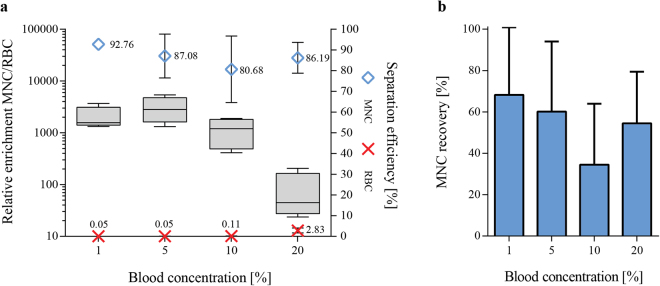
Figure 3.
Whole blood dilution rates influenced separation outcome. (a) The separation efficiencies of MNC (blue) and RBC (red) in the side outlet fraction as well as the relative enrichment of MNC to RBC as compared to the input blood sample (boxplot) for different blood concentrations are shown (n = 4). (b) The recovery of MNC for the different blood concentrations was calculated as the percentage of cells in the output to the input sample. Blood was diluted in 80% SIP and separated at 25 Vpp (mean ± SD, n = 4).

