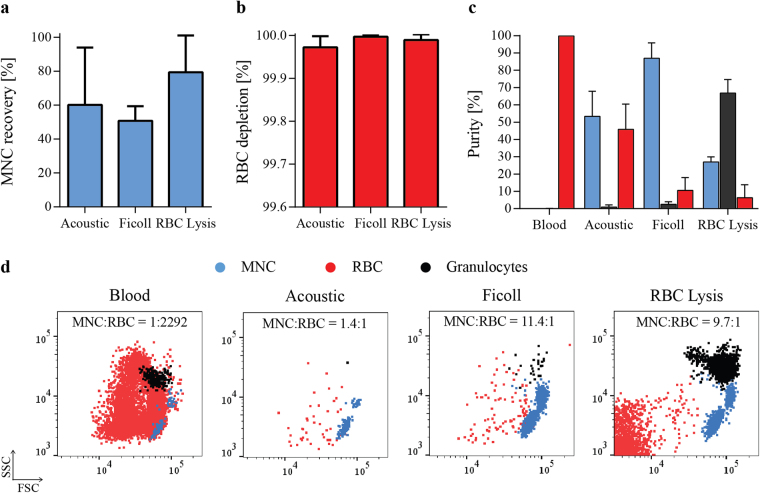
Figure 4.
Comparison of acoustophoresis and standard separation methods. (a) Recovery of MNCs, calculated as the percentage of cells in the output compared to the input cell amount, and (b) depletion of RBCs are shown for acoustic separation as well as for density gradient centrifugation (Ficoll) and RBC lysis (mean ± SD, n = 3). (c) Purities of the different populations as obtained by each separation method were calculated as the ratio of MNCs (blue), granulocytes (black) and RBCs (red) respectively to the total number of cells in the separated sample (mean ± SD, n = 3). (d) Representative FACS plots show the distribution of the different cell types in the starting blood sample (left) as well as after the different separation methods.

