Abstract
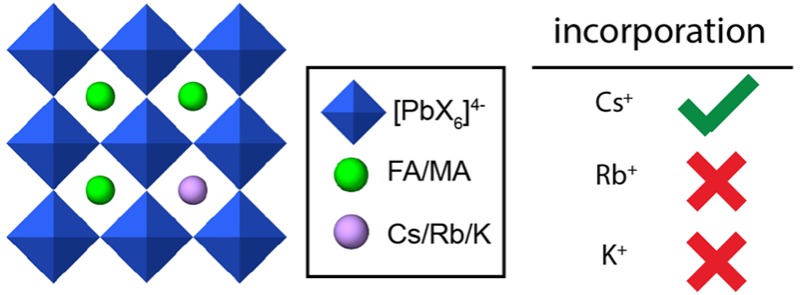
Hybrid (organic–inorganic) multication lead halide perovskites hold promise for a new generation of easily processable solar cells. Best performing compositions to date are multiple-cation solid alloys of formamidinium (FA), methylammonium (MA), cesium, and rubidium lead halides which provide power conversion efficiencies up to around 22%. Here, we elucidate the atomic-level nature of Cs and Rb incorporation into the perovskite lattice of FA-based materials. We use 133Cs, 87Rb, 39K, 13C, and 14N solid-state MAS NMR to probe microscopic composition of Cs-, Rb-, K-, MA-, and FA-containing phases in double-, triple-, and quadruple-cation lead halides in bulk and in a thin film. Contrary to previous reports, we have found no proof of Rb or K incorporation into the 3D perovskite lattice in these systems. We also show that the structure of bulk mechanochemical perovskites bears close resemblance to that of thin films, making them a good benchmark for structural studies. These findings provide fundamental understanding of previously reported excellent photovoltaic parameters in these systems and their superior stability.
Introduction
Hybrid organic–inorganic multication lead halide perovskites (HOPs) have taken the field of photovoltaics by storm since their first successful application as sensitizers for solar cells.1 They generate intense interest as a conceivable alternative to traditional silicon solar cells, as they can be processed using various vapor-2 and solution-based,3−5 techniques. Since the first report, power conversion efficiencies (PCE) have increased from 3.8% to about 22%.6 Key to this remarkable progress was the notion of alloying structurally similar perovskites into multication and multianion lead HOPs.6
A generic HOP can be represented by an ABX3 formula, in which A stands for a monovalent cation such as methylammonium, (CH3NH3+, MA), formamidinium (CH3(NH2)2+, FA), cesium, or rubidium. A cations are confined within a cuboctahedral cage formed by [BX6]4− octahedra. B is typically a divalent metal such as Pb2+, Sn2+, or Ge2+, and X is a halide: I–, Br– or Cl–. Current champion HOP materials, in terms of their photovoltaic performance and light/moisture stability, are double- (MA/FA,7−9 Cs/FA,10−13 Rb/FA,14 K/MA15), triple- (Cs/MA/FA,16 Rb/MA/FA17,18), and quadruple-cation (Rb/Cs/MA/FA)6 lead halide solid alloys with one (I) or two (I, Br) halides. They are all based on FA as the majority cation owing to the fact that the black α-FAPbI3 phase has a bandgap of 1.40 eV, which is close to the Shockley–Queisser limit (1.34 eV), a factor crucial in the design of efficient PV materials.19 However, the α phase of FAPbI3 is thermodynamically unstable under ambient conditions, and it spontaneously transforms into photoinactive yellow δ-FAPbI3. Incorporation of MA, Cs, and Rb was found to alleviate the problem of phase stability, but the consequences reach well beyond that, since devices based on mixed-cation phases consistently exhibit higher open-circuit voltage (VOC), short-circuit current (JSC), fill factor (FF), PCE, and long-term stability toward light and moisture.
While several hypotheses have been put forward to explain these results, there is still no satisfactory understanding of the microscopic structure in these mixed-cation systems. For example, powder X-ray diffraction (pXRD) is currently the method of choice to assess whether the incorporation of an ancillary cation was successful. This is typically inferred from a shift (on the order of 0.05°) of the main reflection of the α-FAPbI3 phase (14.00°) to higher angles, indicative of a decrease in lattice constant, and accompanied by a shift in photoluminescence (PL) spectra.11,16 However, diffraction-based methods lack information about the noncrystalline and disordered regions of the sample, and they are not quantitative. Solid-state NMR, on the other hand, seems to be perfectly suited for the task. It has been used in several recent examples to probe PV perovskites.20−25 It not only provides quantitative information but also is capable of detecting all species of a given nucleus that are present in the sample, regardless of the degree of crystallinity. For instance, recently Rossini et al. have shown that 207Pb NMR chemical shifts and line shapes are a sensitive probe of the halogen coordination in pure and mixed-halogen HOPs. Our group has very recently used solid-state NMR to elucidate microscopic phase composition and segregation in MA/FA HOPs.26
Here we show that in Cs/FA solid alloys, cesium is incorporated into the perovskite lattice as Cs+ and can take up to 15 mol % of the A site. Above this ratio, it separates into a mixture of disordered δ-CsPbI3 and free δ-CsPbI3. Similarly, we confirm incorporation of Cs+ into the state-of-the-art triple- (Cs/MA/FA) and quadruple-cation (Rb/Cs/MA/FA) PV perovskites. In contrast, we find that Rb+ is not incorporated into the 3D perovskite lattice at any composition studied here. Rather, it separates into RbPbI3 (in Rb-doped systems with only iodine), mixed cesium–rubidium lead iodide (in Cs- and Rb-doped systems with only iodine), or a mixture of rubidium halides, mixed cesium–rubidium lead iodide, and various rubidium lead bromides (in Rb/Cs/MA/FA systems with bromine and iodine). The improved performance of the Rb containing materials is thus not due to incorporation into the main perovskite lattice. We suggest that the performance is improved since the Rb compounds present can potentially act as a passivation layer. In the case of K/MA, pure MAPbI3 is formed, accompanied by unreacted KI.
All of the above results were obtained for samples prepared by mechanochemistry which has emerged as an appealing method for synthesizing large quantities of high-quality perovskites for PV applications.27 We thus address the question of whether bulk mechanochemically synthesized perovskites are a good representation of the thin films used in PV devices. Comparison of NMR spectra from a bulk mechanochemical triple-cation Cs/MA/FA perovskite and a thin film prepared by spin-coating3 shows no significant differences between the two materials, validating that bulk mechanochemical perovskites can be used to obtain structural information about newly developed HOP systems.
Experimental Section
Perovskite Synthesis and Sample Preparation
We focus on the following perovskite materials of practical importance: CsxFA1–xPbI3 (x = 0.10, 0.15, 0.20, 0.30, abbreviated as “CsxFA1–x”); Cs0.10(MA0.17FA0.83)0.9Pb(I0.83Br0.17)3 (“CsMAFA”, prepared according to Saliba et al.);16 RbxFA1–xPbI3 (x = 0.1, 0.2, abbreviated as “RbxFA1-x”); a Rb/Cs/MA/FA/Pb/Br/I material prepared according to Saliba et al. (“RbCsMAFA(Br,I)”),6 and K0.10MA0.90PbI3.15 We also prepared the following materials with only iodine as counterion: Rb0.05Cs0.10FA0.85PbI3, Rb0.05MA0.25FA0.70PbI3, Rb0.05Cs0.10MA0.25FA0.60PbI3, abbreviated respectively as RbCsFA(I), RbMAFA(I), and RbCsMAFA(I). Further, we made the following compounds to use as references: δ-CsPbI3 (yellow), δ-RbPbI3 (yellow); Cs0.5Rb0.5PbI3 (pale yellow); and RbPb2Br5 (white). We attempted to prepare Rb4PbBr6,28 but instead we obtained a mixture of RbBr and an unknown rubidium lead bromide whose pXRD pattern did not correspond to any known Rb/Pb/Br phase in the ICDD database. We designate this composition as “phase X” and report its pXRD pattern and NMR parameters (single Rb site with CQ = 3.4 MHz) in the SI. pXRD patterns of all the materials are given in the SI.
All materials were prepared by mechanochemistry, as described previously by Prochowicz et al. and annealed at 140 °C for 10 min to reproduce the thin-film synthetic procedure.27,29 The thin film of CsMAFA was prepared according to the procedure described previously, except an uncoated glass substrate was used instead of FTO-coated glass.16 Samples were packed into 3.2 mm rotors under inert dry nitrogen atmosphere.
Thin-Film Preparation
The CsMAFA(Br,I) perovskite precursor solution was prepared according to the previously published recipe.16 The solution was deposited onto a glass substrate (3.5 cm2) by spin coating in a two-step program at 1000 and 6000 rpm for 10 and 20 s, respectively. During the second step, 100 μL of chlorobenzene was dripped onto the spinning substrate 10 s prior to the end of the program. The substrates were then annealed at 100 °C for 30 min in a drybox. The films were then scratched off of the glass substrates using a stainless steel spatula. Twelve glass substrates were used in total (42 cm2) yielding about 1.5 mg of a solid perovskite which was then immediately transferred into an NMR rotor.
NMR Measurements
Variable-temperature 133Cs (65.6 MHz), 87Rb (163.6 MHz), 14N (32.1 MHz), 39K (23.4 MHz), 13C (125.7 MHz), and 1H (500.0 MHz) NMR spectra were recorded on a Bruker Avance III 11.7 T spectrometer equipped with a 3.2 mm low-temperature CPMAS probe. 133Cs, 87Rb, and 39K shifts were referenced to 1 M aqueous solutions of the respective alkali metal chlorides, using solid CsI (δ = 271.05 ppm), RbI (δ = 177.08 ppm), and KI (δ = 59.3 ppm) as secondary references.30
133Cs and 87Rb Chemical Shift Calculations
The perovskite (Cs/Rb/FA)PbI3 clusters and the reference (Rb/Cs)I clusters were generated as described in the SI. Chemical shift calculations were performed at DFT level using the GGA BP8631,32 functional with all-electron TZ2P basis functions (triple-ζ in the valence with two polarization functions) including relativistic effects (with spin–orbit coupling) with the ZORA33−35 approximation and the Grimme36 dispersion correction implemented within the Amsterdam Density Functional (ADF)37,38 suite.
The calculated chemical shieldings were converted to chemical shifts by a linear correlation.
For the linear correlation, only the experimental and calculated chemical shifts of the reference (Cs/Rb)I and the hexagonal (yellow) (Cs/Rb)PbI3 structures were used, leading to a reference shielding and a slope of σref = 2768.6, b = −0.825 for Rb and σref = 3480.1, b = −0.54 for Cs. In both cases, we ignored second-order quadrupolar contributions to the shift since they are zero in the cubic compounds (CsI, RbI) and negligible in CsPbI3 (calculated CQ of 0.4 MHz leading to a shift of <1 ppm) and RbPbI3 (at most 4 ppm given the fitted CQ of around 2 MHz).
Results and Discussion
Figure 1 shows a schematic representation of the crystal structures of the studied materials. The starting point for all solid alloys investigated in this study is the perfect cubic perovskite structure of α-FAPbI3 (Figure 1a).19 Solid alloys can be formed by replacing some FA cations inside the cuboctahedral cages by MA and conceivably Cs and Rb (Figure 1b), accompanied by gradual departure from cubic symmetry. Excess Cs+ and Rb+ ions can separate into a thermodynamically stable, yellow, nonperovskite (orthorhombic, Pnma space group) phase: δ-CsPbI3 or RbPbI3, respectively (Figure 1c). We note that to date there are only two single-crystal studies reported on mixed-cation (MA/FA)39 and (Cs/FA)40 systems.
Figure 1.
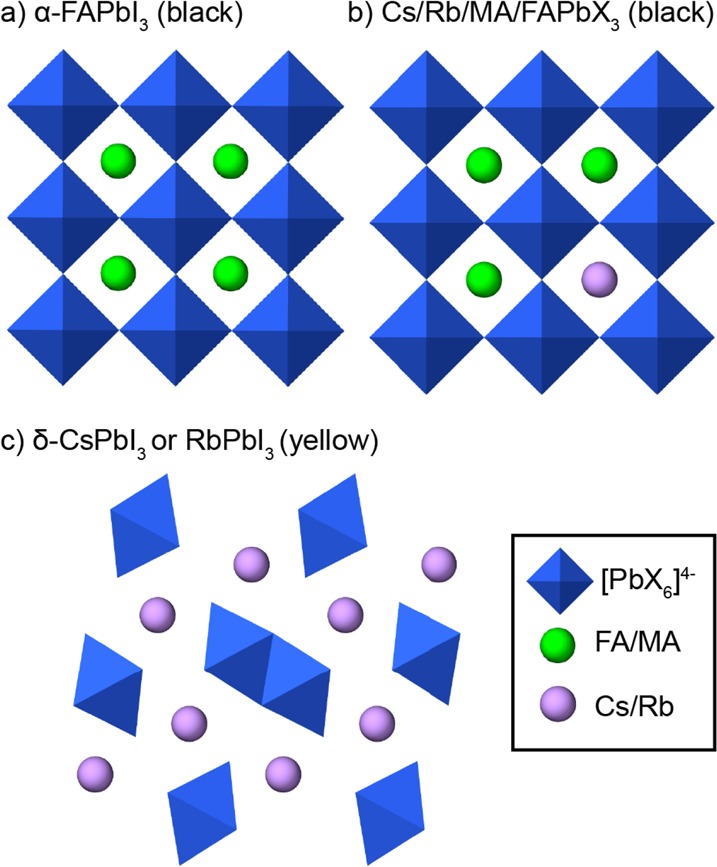
Schematic representation of structural motifs investigated in this study: (a) black single-cation α-FAPbI3; (b) black double- (CsFA, RbFA), triple- (CsMAFA), or quadruple-cation (RbCsMAFA) compositions (X = I, Br); and (c) yellow nonperovskite δ-FAPbI3.
Cesium Phases from 133Cs MAS NMR
In order to determine cesium incorporation into PV perovskites, we performed 133Cs MAS NMR on the most prominent cesium-containing materials recently reported in the literature (Figure 2). The spectrum of δ-CsPbI3, (Figure 2a) contains one relatively narrow (fwhm: ∼ 350 Hz) peak centered at 240 ppm, accompanied by a manifold of spinning sidebands (SSB), spaced by the MAS frequency. The longitudinal relaxation time (T1) of this species is about 100 s.
Figure 2.
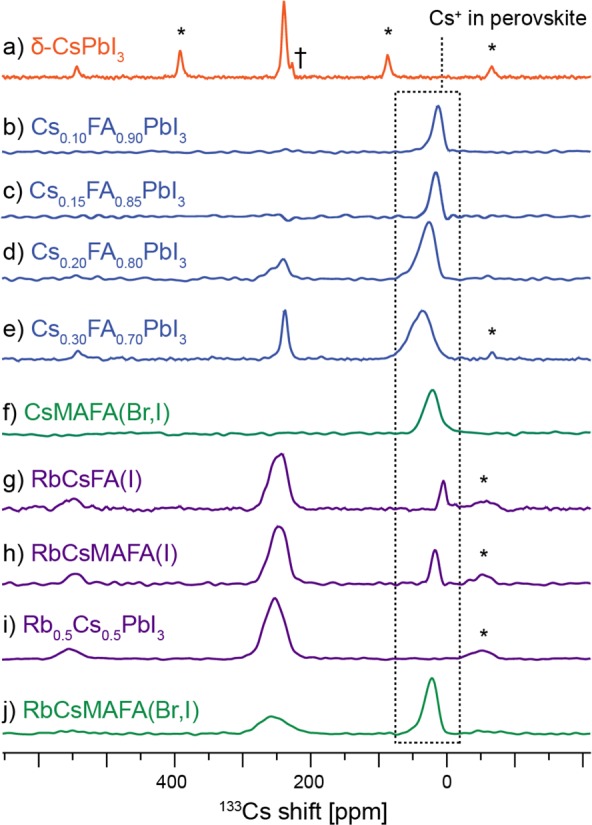
Quantitative 133Cs echo-detected MAS spectra of various (Cs/Rb/MA/FA)Pb(Br/I)3 systems at 298 K and (a) 10 kHz MAS and (b–j) 20 kHz MAS acquired within 1 h after annealing. Asterisks (*) indicate spinning sidebands, and † is a transmitter artifact.
Moving on to the CsxFA1–x solid alloys (Figure 2b–e), one sees a new, much broader peak whose position and line width depend on cesium content (shifts: 13, 18, 26, and 37 ppm, fwhm: 1169 ± 21, 858 ± 15, 1477 ± 51, and 2261 ± 51 Hz for Cs mole ratio x = 0.10, 0.15, 0.20, and 0.30, respectively). This new species is peculiar in that its 133Cs signal position and relaxation time are a strong function of temperature.
Figure 3 shows the temperature dependence of the 133Cs shift and line shapes in Cs0.20FA0.80 between 100 and 330 K. The corresponding smooth change in the 133Cs shift in this temperature range covers about 100 ppm and is accompanied by a change in relaxation time from 26 s (at 298 K) to 3 s (at 103 K). This behavior is consistent with the Cs+ cation being incorporated into the cuboctahedral space and interacting strongly with the [PbI6]4− lattice. The change in relaxation time is caused by the change dynamics of the nearby nuclei and/or a change in the 133Cs quadrupolar coupling as the lattice changes with temperature. Indeed, upon cooling the lattice undergoes successive first- and second-order displacive phase transitions attributed to gradual freezing of phonon modes associated with the rotational movement of the [PbI6]4− octahedra.41,42 The progressive broadening of the resonances is most likely caused by a distribution of sites with slightly different chemical environments that is created upon the freezing of [PbI6]4− librations. Conversely, no such behavior is present in pure δ-CsPbI3 (or CsI) which preserve sharp lines across the whole temperature range, indicating no phase transitions (Figure S9a,c).
Figure 3.
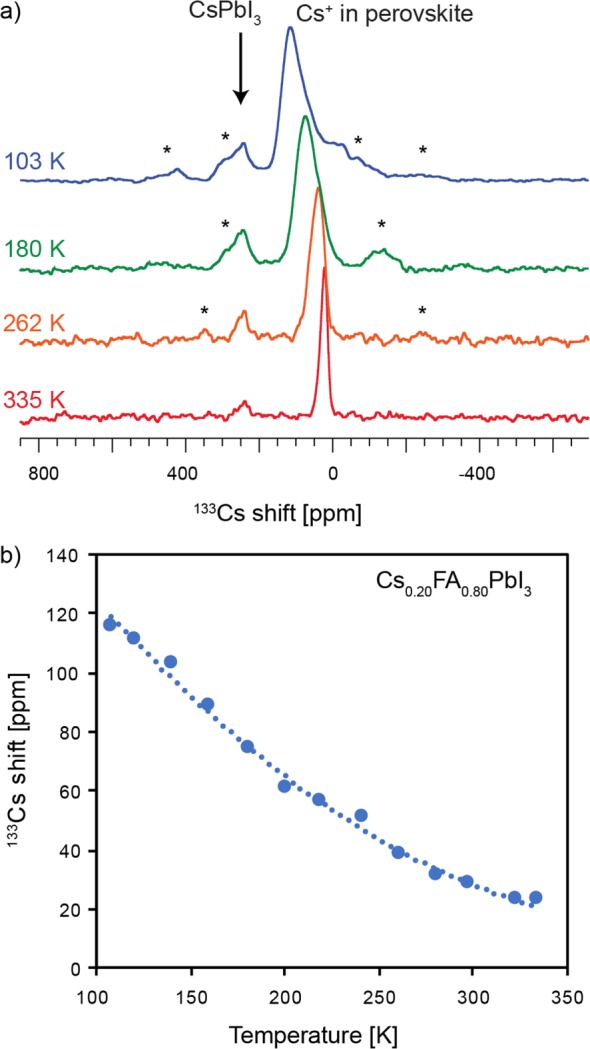
(a) Variable-temperature solid-state 133Cs MAS NMR spectra of Cs0.20FA0.80. (b) Temperature dependence of the 133Cs shift (measured at the maximum of the most intense peak). Spinning sidebands are marked with asterisks (*).
In attempt to elucidate the change in shifts, we carried out fully relativistic DFT 133Cs chemical shift calculations for two FAPbI3 lattices in which one FA was replaced by Cs in (a) a perfectly cubic and (b) a tetragonal perovskite lattice arrangement. We have found that distorting the lattice from cubic to tetragonal leads to an increase in 133Cs shift of the same magnitude as that observed experimentally (Figure S13). That said, this result is only qualitative since the Cs0.20FA0.80 lattice, unlike that of α-FAPbI3, is not perfectly cubic. This comes about because incorporation of cesium leads to lattice distortions and in turn to reduction in symmetry of the environment in which the FA cation is reorienting. We have previously shown that 14N MAS NMR is very sensitive to such distortions owing to the interaction of its quadrupole moment with the electric field gradient created by the distorted lattice, with higher asymmetry leading to broader 14N spectral envelopes.26 Cs-induced lattice distortion is indeed clearly evidenced by 14N MAS spectra of the two materials, with cesium incorporation leading to a spectral envelope nearly 4 times broader than that of the pure α-FAPbI3 phase (Figure S10).
To corroborate that the signal close to 30 ppm at 298 K originates from Cs+ incorporated inside the perovskite lattice, we carried out a through-space heteronuclear correlation experiment (HETCOR), which maps all cesium chemical environments that are in the immediate spatial vicinity of any protons (Figure 4). The experiment was carried out at 100 K to take advantage of the faster proton relaxation at low temperature.26 The cross-peak can be easily assigned, since there is only one source of protons in the sample, to Cs+ dipolar coupled to FA. It is thus Cs+ inside the 3D perovskite lattice, which correlates with the nearby FA protons.26
Figure 4.
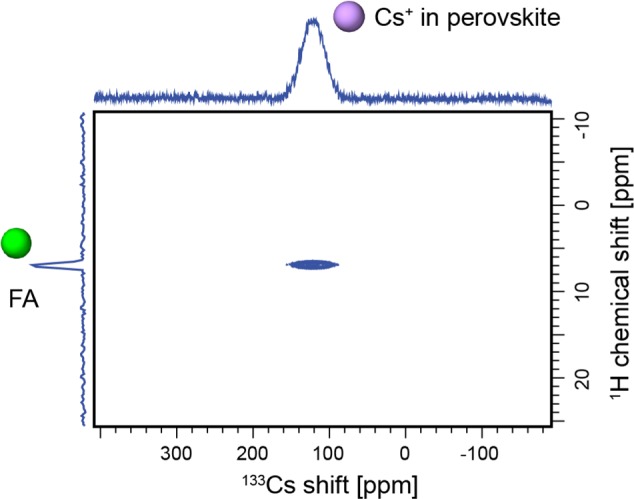
A 1H–133Cs HETCOR of Cs0.20FA0.80 at 100 K and 12 kHz MAS.
Another characteristic feature of the spectra in Figure 2b–e is the resonance around 240 ppm corresponding to the δ-CsPbI3 phase. In Cs0.10FA0.90 and Cs0.15FA0.85, it is absent, whereas in Cs0.20FA0.80 and Cs0.30FA0.70, it is clearly present, confirming phase separation takes place in these systems above 10% doping. Note that this resonance has a slightly broader component shifted to higher values, visible in Figure 2d. This broadened signal can tentatively be assigned to a disordered interface region between the CsFA alloy and pure δ-CsPbI3.
A comment is in order regarding the stability of CsxFA1–x compositions. Photovoltaic parameters measured on devices fabricated using Cs0.15FA0.85PbI3 have been monitored over the course of 14 days and found stable during that period.10 Nazarenko et al. have reported that single crystals of CsxFA1–xPbI3 compositions are stable up to 20 days after which time the presence of hexagonal δ-FAPbI3 can be detected.40 Here we find that mechanochemically prepared CsxFA1–x compositions are thermodynamically unstable and give off δ-CsPbI3 over time. For example, the composition denoted Cs0.10FA0.90 is, based on the quantitative 133Cs spectrum acquired immediately after annealing, a phase pure perovskite but separates into a mixture of Cs0.07FA0.93PbI3 and δ-CsPbI3 after 24 h. Similarly, Cs0.20FA0.80 after annealing is a mixture of Cs0.16FA0.84PbI3 and δ-CsPbI3, but the same preparation after 5 days contains Cs0.14FA0.86PbI3 and a correspondingly larger amount of δ-CsPbI3. The Cs0.30FA0.70 composition is particularly unstable reproducibly yielding a transitory Cs0.23FA0.77PbI3 perovskite (within 30 min from annealing) which quickly loses the incorporated cesium in favor of δ-CsPbI3 and becomes Cs0.15FA0.85PbI3 (after 1 h), Cs0.08FA0.92PbI3 (after 2 h), and finally stabilizing as Cs0.03FA0.97PbI3 after 5 h. Note that the shortest quantitative spectrum takes 30 min to acquire so it is possible that in this sample more cesium is transiently incorporated during annealing, leading to lattice instability and, as a consequence, rapid cesium release. We did not further investigate the reasons behind this instability. The fact that its timescale is much faster than that observed in single crystals suggests it may be related to grain boundaries, with smaller crystallites promoting cesium loss from the 3D perovskite lattice. Notably, this process stops at 100 K.
The performance of Cs-containing materials continues to increase as loadings increase to 15%, consistent with full cesium incorporation in the Cs0.15FA0.85 composition (Figure 2c).10 Lee et al. have reported enhanced photo- and moisture stability of CsxFA1–x solid alloys, which they attributed to stronger interaction between FA and I– in the perovskite.11 Other studies have confirmed increased stability both experimentally and theoretically, by rationalizing through entropic stabilization of the cubic α-FAPbI3 structure.10,13 Poor stability of the pristine α-FAPbI3 phase at ambient conditions against humidity, as well as elevated temperature, has been explained by its propensity to decompose into ammonia and sym-triazine.41 Further, the presence of excess δ-CsPbI3 explains the consistently poorer photovoltaic parameters measured on CsxFA1–x devices with x > 0.15.10 It is noteworthy that an opposite effect has been reported for excess PbI2 which typically led to improved photovoltaic parameters but has been shown to be detrimental to device stability.43
Cesium has been shown to improve PV parameters and stability in triple- and quadruple-cation compositions in a similar way. Figure 2f,j shows 133Cs spectra of two of the currently best performing solid alloys, CsMAFA(Br,I) and RbCsMAFA(Br,I), respectively. In both cases, a broad peak of Cs+ incorporated into the perovskite lattice is present. RbCsMAFA(Br,I) exhibits an additional broad peak (δ = 255.4 ± 0.3 ppm, fwhm = 2662 ± 55 Hz) making up 47% of the whole amount of cesium in this sample, markedly different in appearance from that of δ-CsPbI3 (δ = 239.32 ± 0.03 ppm, fwhm = 367 ± 7 Hz). Given the similarity between the hexagonal lattices of δ-CsPbI3 and RbPbI3, we suggest it might belong to a mixed cesium–rubidium lead iodide phase. This was confirmed by preparing pure Cs0.5Rb0.5PbI3 (Figure 2i) which yielded a very similar signal (δ = 253.2 ± 0.2 ppm, fwhm = 2034 ± 27 Hz). We note that the exact shift and line width are expected to vary depending on the exact Rb/Cs ratio in such 1D mixed-cation hexagonal phase. To exclude the possibility of this peak being due to a bromine-containing species, we prepared two more Cs/Rb compositions (Figure 2g,h) featuring only iodine as counterion, both of which gave the same resonance (RbCsFA(I): δ = 247.3 ± 0.3 ppm, fwhm = 1468 ± 66 Hz, RbCsMAFA(I): δ = 248.4 ± 0.3 ppm, fwhm = 1592 ± 63 Hz), confirming the assignment to Cs0.5Rb0.5PbI3. This finding implies that rubidium competes with cesium incorporation into the perovskite lattice by forming a stable hexagonal mixed Cs/Rb phase. In fact, in the case of pure iodides (RbCsFA(I) and RbCsMAFA(I)), there is more cesium bound in the mixed cesium–rubidium hexagonal lead iodide (92 and 84%, respectively) than there is cesium incorporated into the perovskite (8 and 16%, respectively) (Figure 2g,h). The addition of bromine (in RbCsMAFA(Br,I)) alleviates this effect to certain extent (Figure 2j).
Rubidium Phases from 87Rb MAS NMR
We now investigate the fate of rubidium in rubidium-doped multication perovskites. Figure 5 shows solid-state 87Rb MAS NMR spectra of 10 compositions studied here. The spectra of RbxFA1-x and RbMAFA(I) perfectly match that of RbPbI3, indicating that the only form in which Rb+ exists in these systems is a separate RbPbI3 phase. Rb is not incorporated into the MAFA perovskite lattice. This finding challenges previous reports on rubidium incorporation into the perovskite lattice which were based on shifts observed in pXRD diffractograms and PL spectra.14,17,18 A very recent work by Hu et al. explains these shifts using EDX in terms of rubidium-induced bromide extraction, which is in excellent agreement with our findings described in the next paragraph.44 Similarly to the Cs-doped HOPs, Rb-doped materials also exhibit improved long-term stability under high humidity conditions and light irradiation.14,17,18 We suggest that this can be explained by passivation of the perovskite phase by a fully inorganic RbPbI3 layer, less prone to decomposition.
Figure 5.
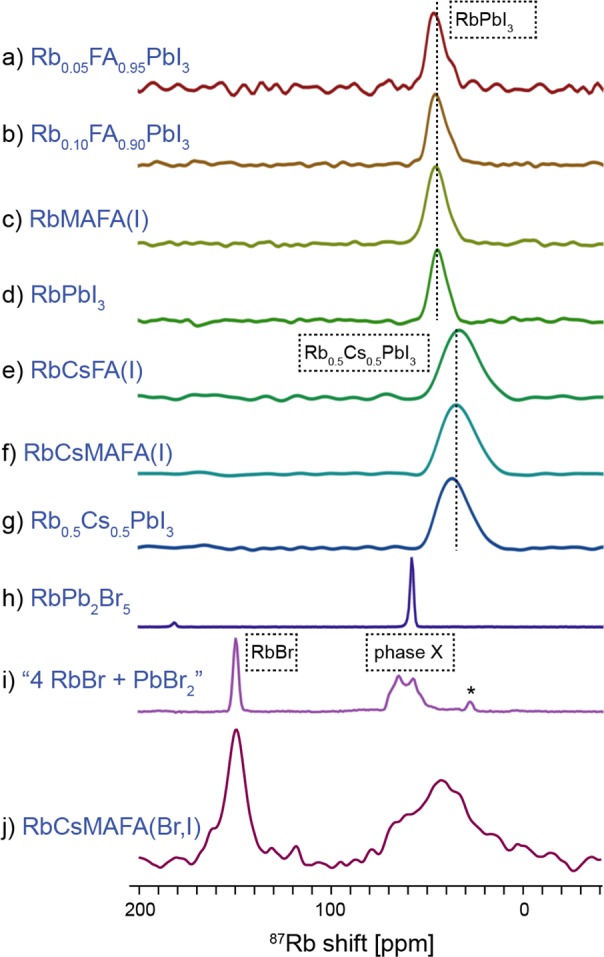
11.7 T Solid-state 87Rb echo-detected MAS (20 kHz, 298 K) spectra of various (Cs/Rb/MA/FA)Pb(Br/I)3 systems. The corresponding 100 K 13C CP MAS spectra of a–c, e, f, and j show only one FA signal corresponding to it being in a 3D perovskite environment (Figure S11).
As mentioned above, we find that cesium tends to form a stable Cs0.5Rb0.5PbI3 phase in the presence of rubidium. This is confirmed here, as the 87Rb spectra of RbCsFA(I) and RbCsMAFA(I) both match that of Cs0.5Rb0.5PbI3 (Figure 5e–g). To ensure this is not simply sheer coincidence, we measured the same spectrum at 100 K. If this rubidium species were to be incorporated inside the perovskite lattice, then one should expect their shift to be strongly temperature dependent, as was the case for cesium (Figure 3). On the contrary, we observed only a small shift of ∼6 ppm, consistent with ordinary lattice shrinkage at low temperatures (Figure S9b,d).45 In addition, we carried out a fully relativistic DFT calculation of the 87Rb shift expected for a rubidium cation incorporated into the α-FAPbI3 lattice, using the known RbI and δ-RbPbI3 shifts as a reference (see the SI for details). We obtained a value of −117 ppm, which is very different from the shift observed experimentally (Figure 5e,f,j).
Figure 5j shows a 87Rb MAS spectrum of the state-of-the-art quadruple-cation composition developed by Saliba et al.6 Again, there is no evidence for incorporation of the Rb into the CsMAFA perovskite lattice. In this case, since this composition also contains bromide anions, rubidium can be expected to form both iodide- and bromide-containing species. The spectrum in Figure 5j exhibits a relatively sharp peak at 150 ppm which corresponds to a pure RbBr phase.30 Pure RbI is expected at 177 ppm,30 and in this sample, it is not present. That said, rubidium is known to form a continuum of mixed RbI1–xBrx phases,46 which explains the distribution of shifts in the region, delimited by the values of pure RbI and RbBr (150–177 ppm). The mixed RbI1–xBrx phases make up 38% of rubidium content in this sample and are responsible for bromide depletion from the perovskite, the reason behind the previously observed XRD and PL shifts, at the time ascribed to rubidium incorporation into the perovskite lattice.44 The other, much broader peak centered around 50 ppm can be attributed to a mixture of rubidium lead halides. Its breadth is consistent with the presence of RbPbI3, Cs0.5Rb0.5PbI3 (Figure 6d,g), and “phase X” (Figure 5i). The presence of RbPb2Br5 cannot be excluded as its sharp signal is overlapping with the broad peak of RbCsMAFA(Br,I). The only other known rubidium lead bromide is Rb4PbBr6,28 and since we did not succeed in synthesizing it by mechanochemistry, its presence in this composition is unlikely. As before, and also in this case, the two 87Rb signals in RbCsMAFA(Br,I) do not broaden or shift significantly between 298 and 100 K (Figure S9e), which provides further evidence that these rubidium species are not involved in the displacive phase transition of the perovskite lattice, as was the case for incorporated Cs+ ions.
Figure 6.
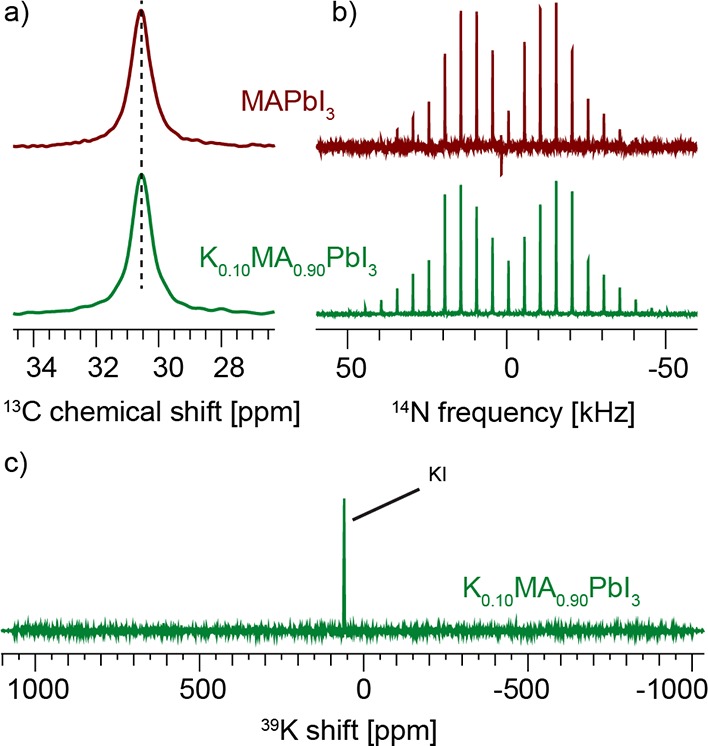
(a) Low-temperature (100 K) 13C CP MAS spectra, (b) echo-detected 14N MAS spectra at 300 K and 5 kHz MAS of MAPbI3 (top) and K0.10MA0.90PbI3 (bottom), and (c) echo-detected 39K spectrum of K0.10MA0.90PbI3 at 300 K and 20 kHz MAS (20 s recycle delay, 12 h total acquisition time).
The hypothesis that rubidium-rich phases may act as a passivation layer is supported by a recent XPS study which has found unexpectedly high (with respect to a theoretical homogeneous distribution) concentration of Cs and Rb in the 18 nm surface layer of a RbCsMAFA(Br,I) thin film.47 Taken with the NMR result suggesting the formation of δ-Cs0.5Rb0.5PbI3, it indicates that the mixed rubidium/cesium hexagonal phase has a propensity to form at the top of the perovskite film during solution processing, thereby isolating it from ambient humidity.
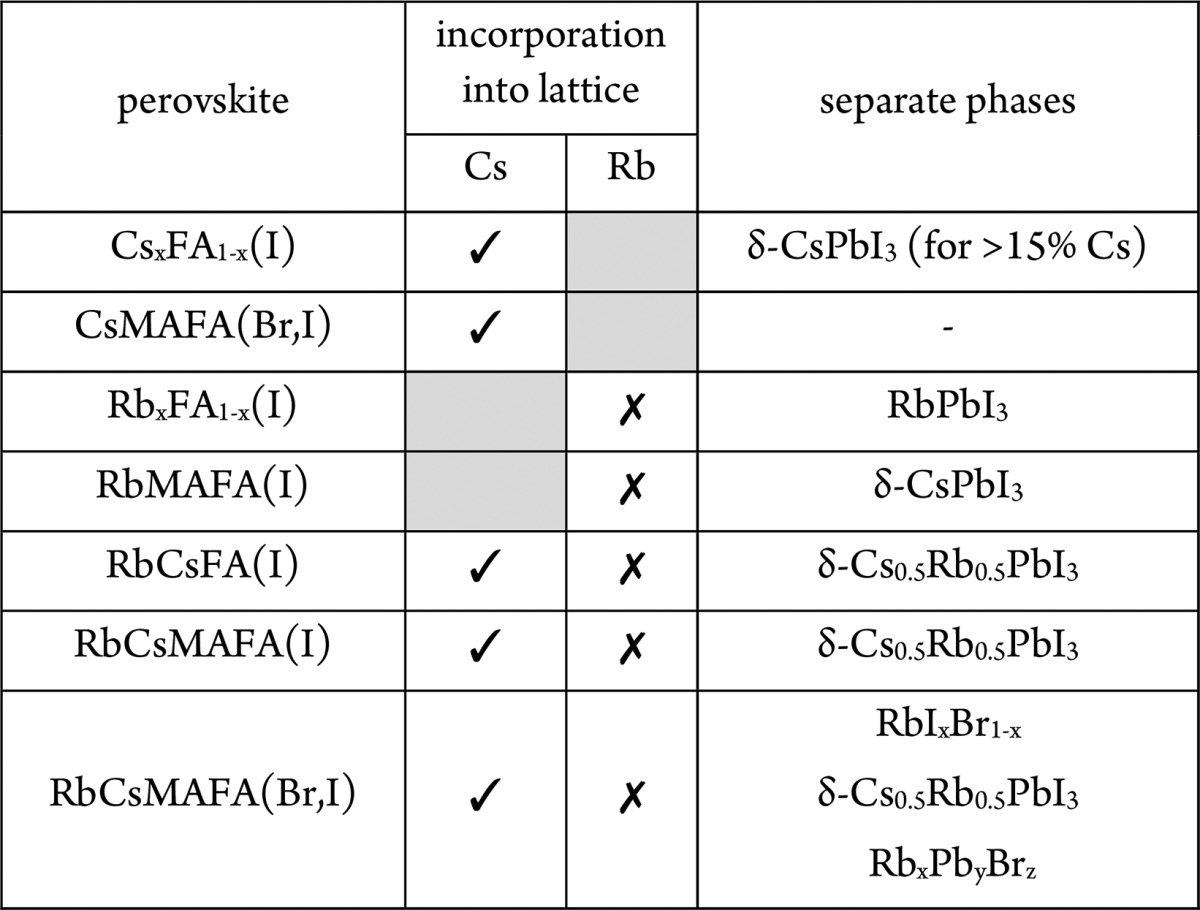
In summary, Table 1 rounds up the capacity for incorporation of Cs+ and Rb+ into perovskite lattices found here.
Table 1. Incorporation Capacity of Cs+ and Rb+ into FAPbI3-Based Perovskite Lattices.
Potassium has an atomic radius similar to that of rubidium, and its incorporation has recently attracted attention as a means of improving PV performance of perovskite materials.15,48 Here we investigate the simplest case of K0.10MA0.90PbI3. Figure 6a,b shows a comparison between 13C and 14N spectra of MAPbI3 and K0.10MA0.90PbI3. The spectra are, to within error, identical and indicate that no potassium incorporation into the MAPbI3 lattice takes place. Further, the 39K spectrum of K0.10MA0.90PbI3 acquired over 12 h shows only the presence of unreacted potassium iodide used as a precursor. Given the similarity of the atomic radii of Rb and K, and in light of the above discussion, it is not surprising that no potassium incorporation takes place.
Bulk Microstructure Matches That of Thin Films
The bulk perovskites synthesized by means of mechanochemistry studied here are also potentially a convenient source of material for scaling up the production of PV perovskites.27,29 However, so far it has been unclear whether their microscopic structure corresponds to that of thin films prepared by solution processing. In order to address this, we prepared a mechanochemical bulk sample of CsMAFA(Br,I) and compared it with a spin-coated CsMAFA(Br,I) thin film.16
Figure 7 shows solid-state 133Cs, 13C CP and 14N MAS NMR spectra of the two samples. The low-temperature 133Cs spectra are essentially identical and contain one broad peak corresponding to Cs+ incorporated into the perovskite lattice, analogous to the one observed for Cs0.20FA0.80 (Figure 3a, 103 K). The experiment was carried out at 100 K to take advantage of the shorter recycle delay and improve the overall sensitivity. The low-temperature 13C CP spectra (Figure 7b) indicate that only the black phase of FA is present in both cases.26 The two spectra have no significant differences, and their appearance corresponds to that of the MAFA system, given for reference at the top of Figure 7b.
Figure 7.
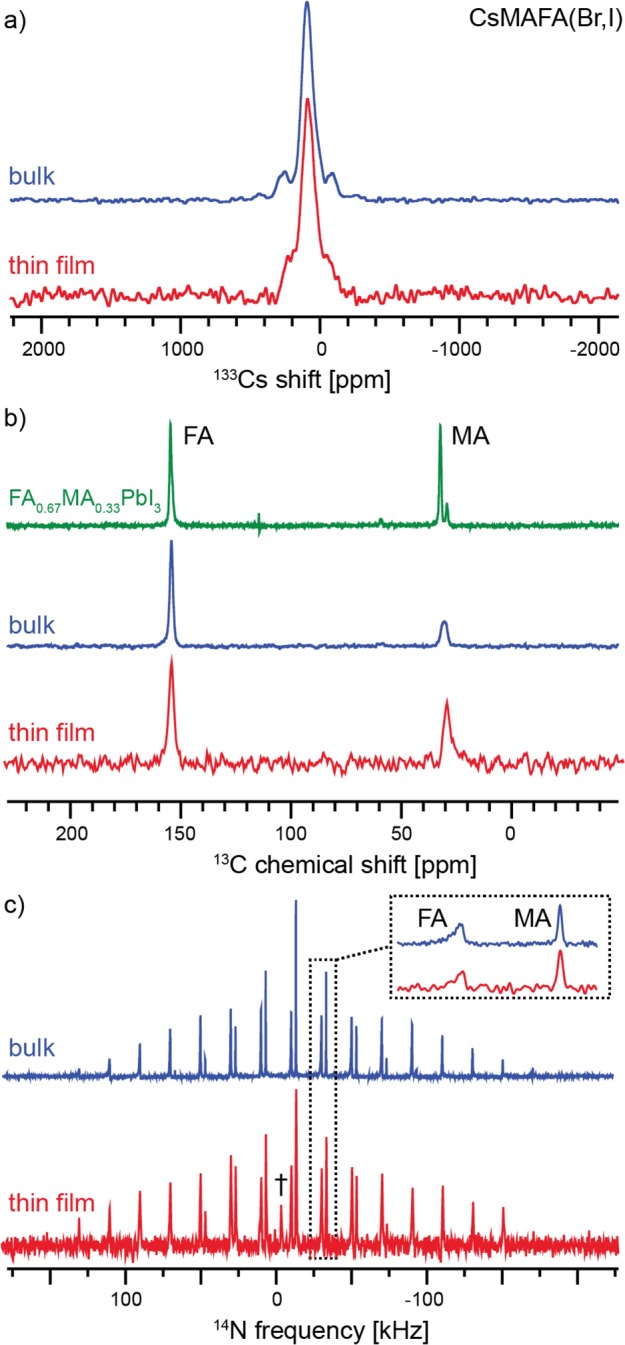
Solid-state MAS NMR spectra of CsMAFA(Br,I) in bulk (blue) and prepared as thin film on glass (red). (a) Echo-detected 133Cs spectra at 100 K and 12 kHz MAS (Figure 2f is the corresponding 298 K spectrum of the bulk material), (b) 13C CP at 100 K and 12 kHz MAS, and (c) 14N echo-detected spectra at 298 K and 20 kHz MAS (acquisition times: bulk 20 h, thin film 60 h). The isotropic signal marked “†” most likely comes from traces of DMF used during spin-coating.
We have previously shown that 14N MAS spectra of mixed-cation phases are a sensitive probe of the cation reorientation dynamics which is encoded in the spectral envelope and line widths.26 Here, the two 14N spectra (Figure 7c) again have very similar envelopes and line widths. However, the observed line widths are in this case determined by inhomogeneous effects (disorder), as evidenced by the fact that they are not Lorentzian in shape and do not change with increasing the temperature, thus preventing us from extracting quantitative information on cation reorientation. On the other hand, the similarity of the two spectral envelopes indicates that the two cations in both cases reorient in a potential of similar symmetry, pointing to a similar extent of lattice distortion in the two materials.
Conclusions
In summary, we have shown that 133Cs and 87Rb solid-state NMR offers a robust way of identifying cesium and rubidium species in multication perovskite materials relevant to photovoltaics.
In particular, we have found that cesium is readily incorporated into the perovskite lattice of FA-based materials up to around 15 mol %. Above 15 mol %, a second δ-CsPbI3 phase is observed. Rubidium, on the other hand, does not form a solid alloy with FA in any of the studied compositions. Rather, it separates into a mixture of rubidium-rich phases (RbPbI3 mixed cesium–rubidium lead iodides, mixture of rubidium halides, various rubidium lead bromides, depending on the exact composition). All of these rubidium-rich phases potentially act as a passivation layer for the perovskite material. We have also found that potassium, which has a size similar to rubidium, is not incorporated into the MAPbI3 lattice.
Further, we have shown that the microscopic composition, as probed by 1D 133Cs, 13C, and 14N MAS NMR, of a bulk mechanochemical perovskite preparation, here CsMAFA(Br,I), is indistinguishable from that of a thin film prepared using the two-step solution process.
Acknowledgments
D.J.K. and D.P. thank Pankaj Y. Kumar and Michael Saliba for insightful discussions. This work was supported by ERC Advanced grant no. 320860 and Swiss National Science Foundation grant no. 200021_160112. D.P. acknowledges support from the Marie Skłodowska-Curie fellowship, H2020, grant agreement no. 707168. M.G. thanks the King Abdulaziz City for Science and Technology (KACST) for financial support.
Supporting Information Available
The Supporting Information is available free of charge on the ACS Publications website at DOI: 10.1021/jacs.7b07223.
Author Contributions
∥ These authors contributed equally to this work.
The authors declare no competing financial interest.
Supplementary Material
References
- Kojima A.; Teshima K.; Shirai Y.; Miyasaka T. J. Am. Chem. Soc. 2009, 131 (17), 6050–6051. 10.1021/ja809598r. [DOI] [PubMed] [Google Scholar]
- Era M.; Hattori T.; Taira T.; Tsutsui T. Chem. Mater. 1997, 9 (1), 8–10. 10.1021/cm960434m. [DOI] [Google Scholar]
- Kitazawa N.; Enomoto K.; Aono M.; Watanabe Y. J. Mater. Sci. 2004, 39 (2), 749–751. 10.1023/B:JMSC.0000011549.46602.d3. [DOI] [Google Scholar]
- Liang K. N.; Mitzi D. B.; Prikas M. T. Chem. Mater. 1998, 10 (1), 403–411. 10.1021/cm970568f. [DOI] [Google Scholar]
- Pradeesh K.; Baumberg J. J.; Prakash G. V. Appl. Phys. Lett. 2009, 95 (3), 033309–033311. 10.1063/1.3186639. [DOI] [Google Scholar]
- Saliba M.; Matsui T.; Domanski K.; Seo J. Y.; Ummadisingu A.; Zakeeruddin S. M.; Correa-Baena J. P.; Tress W. R.; Abate A.; Hagfeldt A.; Gratzel M. Science 2016, 354 (6309), 206–209. 10.1126/science.aah5557. [DOI] [PubMed] [Google Scholar]
- Jeon N. J.; Noh J. H.; Yang W. S.; Kim Y. C.; Ryu S.; Seo J.; Seok S. I. Nature 2015, 517 (7535), 476–480. 10.1038/nature14133. [DOI] [PubMed] [Google Scholar]
- Pellet N.; Gao P.; Gregori G.; Yang T. Y.; Nazeeruddin M. K.; Maier J.; Gratzel M. Angew. Chem., Int. Ed. 2014, 53 (12), 3151–3157. 10.1002/anie.201309361. [DOI] [PubMed] [Google Scholar]
- Li X.; Bi D. Q.; Yi C. Y.; Decoppet J. D.; Luo J. S.; Zakeeruddin S. M.; Hagfeldt A.; Gratzel M. Science 2016, 353 (6294), 58–62. 10.1126/science.aaf8060. [DOI] [PubMed] [Google Scholar]
- Li Z.; Yang M. J.; Park J. S.; Wei S. H.; Berry J. J.; Zhu K. Chem. Mater. 2016, 28 (1), 284–292. 10.1021/acs.chemmater.5b04107. [DOI] [Google Scholar]
- Lee J. W.; Kim D. H.; Kim H. S.; Seo S. W.; Cho S. M.; Park N. G. Adv. Energy Mater. 2015, 5 (20), 1501310–1501318. 10.1002/aenm.201501310. [DOI] [Google Scholar]
- Xia X.; Wu W. Y.; Li H. C.; Zheng B.; Xue Y. B.; Xu J.; Zhang D. W.; Gao C. X.; Liu X. Z. RSC Adv. 2016, 6 (18), 14792–14798. 10.1039/C5RA23359C. [DOI] [Google Scholar]
- Yi C. Y.; Luo J. S.; Meloni S.; Boziki A.; Ashari-Astani N.; Gratzel C.; Zakeeruddin S. M.; Rothlisberger U.; Gratzel M. Energy Environ. Sci. 2016, 9 (2), 656–662. 10.1039/C5EE03255E. [DOI] [Google Scholar]
- Park Y. H.; Jeong I.; Bae S.; Son H. J.; Lee P.; Lee J.; Lee C. H.; Ko M. J. Adv. Funct. Mater. 2017, 27 (16), 1605988–16059815. 10.1002/adfm.201605988. [DOI] [Google Scholar]
- Zhao P.; Yin W.; Kim M.; Han M.; Song Y. J.; Ahn T. K.; Jung H. S. J. Mater. Chem. A 2017, 5 (17), 7905–7911. 10.1039/C7TA01203A. [DOI] [Google Scholar]
- Saliba M.; Matsui T.; Seo J. Y.; Domanski K.; Correa-Baena J. P.; Nazeeruddin M. K.; Zakeeruddin S. M.; Tress W.; Abate A.; Hagfeldt A.; Gratzel M. Energy Environ. Sci. 2016, 9 (6), 1989–1997. 10.1039/C5EE03874J. [DOI] [PMC free article] [PubMed] [Google Scholar]
- Duong T.; Mulmudi H. K.; Shen H. P.; Wu Y. L.; Barugkin C.; Mayon Y. O.; Nguyen H. T.; Macdonald D.; Peng J.; Lockrey M.; Li W.; Cheng Y. B.; White T. P.; Weber K.; Catchpole K. Nano Energy 2016, 30, 330–340. 10.1016/j.nanoen.2016.10.027. [DOI] [Google Scholar]
- Zhang M.; Yun J. S.; Ma Q. S.; Zheng J. H.; Lau C. F. J.; Deng X. F.; Kim J.; Kim D.; Seidel J.; Green M. A.; Huang S. J.; Ho-Baillie A. W. Y. ACS Energy Lett. 2017, 2 (2), 438–444. 10.1021/acsenergylett.6b00697. [DOI] [Google Scholar]
- Weller M. T.; Weber O. J.; Frost J. M.; Walsh A. J. Phys. Chem. Lett. 2015, 6 (16), 3209–3212. 10.1021/acs.jpclett.5b01432. [DOI] [Google Scholar]
- Roiland C.; Trippe-Allard G.; Jemli K.; Alonso B.; Ameline J. C.; Gautier R.; Bataille T.; Le Polles L.; Deleporte E.; Even J.; Katan C. Phys. Chem. Chem. Phys. 2016, 18 (39), 27133–27142. 10.1039/C6CP02947G. [DOI] [PubMed] [Google Scholar]
- Rosales B. A.; Men L.; Cady S. D.; Hanrahan M. P.; Rossini A. J.; Vela J. Chem. Mater. 2016, 28 (19), 6848–6859. 10.1021/acs.chemmater.6b01874. [DOI] [Google Scholar]
- Rosales B. A.; Hanrahan M. P.; Boote B. W.; Rossini A. J.; Smith E. A.; Vela J. ACS Energy Lett. 2017, 2, 906–914. 10.1021/acsenergylett.6b00674. [DOI] [Google Scholar]
- Franssen W. M. J.; van Es S. G. D.; Dervisoglu R.; de Wijs G. A.; Kentgens A. P. M. J. Phys. Chem. Lett. 2017, 8 (1), 61–66. 10.1021/acs.jpclett.6b02542. [DOI] [PubMed] [Google Scholar]
- Knop O.; Wasylishen R. E.; White M. A.; Cameron T. S.; Van Oort M. J. M. Can. J. Chem. 1990, 68 (3), 412–422. 10.1139/v90-063. [DOI] [Google Scholar]
- Senocrate A.; Moudrakovski I.; Kim G. Y.; Yang T. Y.; Gregori G.; Gratzel M.; Maier J. Angew. Chem., Int. Ed. 2017, 56 (27), 7755–7759. 10.1002/anie.201701724. [DOI] [PMC free article] [PubMed] [Google Scholar]
- Kubicki D.; Prochowicz D.; Hofstetter A.; Pechy P.; Zakeeruddin S. M.; Graetzel M.; Emsley L. J. Am. Chem. Soc. 2017, 139 (29), 10055–10061. 10.1021/jacs.7b04930. [DOI] [PubMed] [Google Scholar]
- Prochowicz D.; Franckevicius M.; Cieslak A. M.; Zakeeruddin S. M.; Gratzel M.; Lewinski J. J. Mater. Chem. A 2015, 3 (41), 20772–20777. 10.1039/C5TA04904K. [DOI] [Google Scholar]
- Beck H. P.; Milius W. Z. Anorg. Allg. Chem. 1988, 562 (7), 102–104. 10.1002/zaac.19885620112. [DOI] [Google Scholar]
- Prochowicz D.; Yadav P.; Saliba M.; Saski S. M.; Zakeeruddin S. M.; Lewinski J.; Gratzel M. Sustainable Energy and Fuels 2017, 1, 689–693. 10.1039/C7SE00094D. [DOI] [Google Scholar]
- Hayashi S.; Hayamizu K. Bull. Chem. Soc. Jpn. 1990, 63 (3), 913–919. 10.1246/bcsj.63.913. [DOI] [Google Scholar]
- Perdew J. P. Phys. Rev. B: Condens. Matter Mater. Phys. 1986, 33 (12), 8822–8824. 10.1103/PhysRevB.33.8822. [DOI] [PubMed] [Google Scholar]
- Becke A. D. Phys. Rev. A: At., Mol., Opt. Phys. 1988, 38 (6), 3098–3100. 10.1103/PhysRevA.38.3098. [DOI] [PubMed] [Google Scholar]
- van Lenthe E.; Baerends E. J.; Snijders J. G. J. Chem. Phys. 1994, 101 (11), 9783–9792. 10.1063/1.467943. [DOI] [Google Scholar]
- van Lenthe E.; Baerends E. J.; Snijders J. G. J. Chem. Phys. 1993, 99 (6), 4597–4610. 10.1063/1.466059. [DOI] [Google Scholar]
- van Lenthe E.; Ehlers A.; Baerends E. J. J. Chem. Phys. 1999, 110 (18), 8943–8953. 10.1063/1.478813. [DOI] [Google Scholar]
- Grimme S. J. Comput. Chem. 2006, 27 (15), 1787–1799. 10.1002/jcc.20495. [DOI] [PubMed] [Google Scholar]
- Guerra C. F.; Snijders J. G.; te Velde G.; Baerends E. J. Theor. Chem. Acc. 1998, 99 (6), 391–403. 10.1007/s002140050021. [DOI] [Google Scholar]
- te Velde G.; Bickelhaupt F. M.; Baerends E. J.; Guerra C. F.; Van Gisbergen S. J. A.; Snijders J. G.; Ziegler T. J. Comput. Chem. 2001, 22 (9), 931–967. 10.1002/jcc.1056. [DOI] [Google Scholar]
- Xie L. Q.; Chen L.; Nan Z. A.; Lin H. X.; Wang T.; Zhan D. P.; Yan J. W.; Mao B. W.; Tian Z. Q. J. Am. Chem. Soc. 2017, 139 (9), 3320–3323. 10.1021/jacs.6b12432. [DOI] [PubMed] [Google Scholar]
- Nazarenko O.; Yakunin S.; Morad V.; Cherniukh I.; Kovalenko M. V. NPG Asia Mater. 2017, 9, e373. 10.1038/am.2017.45. [DOI] [Google Scholar]
- Stoumpos C. C.; Malliakas C. D.; Kanatzidis M. G. Inorg. Chem. 2013, 52 (15), 9019–9038. 10.1021/ic401215x. [DOI] [PubMed] [Google Scholar]
- Hirotsu S.; Kunii Y. J. Phys. Soc. Jpn. 1981, 50 (4), 1249–1254. 10.1143/JPSJ.50.1249. [DOI] [Google Scholar]
- Liu F. Z.; Dong Q.; Wong M. K.; Djurisic A. B.; Ng A. N.; Ren Z. W.; Shen Q.; Surya C.; Chan W. K.; Wang J.; Ng A. M. C.; Liao C. Z.; Li H. K.; Shih K. M.; Wei C. R.; Su H. M.; Dai J. F. Adv. Energy Mater. 2016, 6 (7), 1502206–1502215. 10.1002/aenm.201502206. [DOI] [Google Scholar]
- Hu Y.; Aygüler M.; Petrus M. L.; Bein T.; Docampo P. ACS Energy Lett. 2017, 2212–2218. 10.1021/acsenergylett.7b00731. [DOI] [Google Scholar]
- Skibsted J.; Jakobsen H. J. J. Phys. Chem. A 1999, 103 (40), 7958–7971. 10.1021/jp9912861. [DOI] [Google Scholar]
- Swamy T. K.; Subhadra K. G.; Sirdeshmukh D. B. Pramana 1994, 43 (1), 33–39. 10.1007/BF02847597. [DOI] [Google Scholar]
- Philippe B.; Saliba M.; Correa-Baena J. P.; Cappel U. B.; Turren-Cruz S. H.; Gratzel M.; Hagfeldt A.; Rensmo H. Chem. Mater. 2017, 29 (8), 3589–3596. 10.1021/acs.chemmater.7b00126. [DOI] [Google Scholar]
- Nam J. K.; Chai S. U.; Cha W.; Choi Y. J.; Kim W.; Jung M. S.; Kwon J.; Kim D.; Park J. H. Nano Lett. 2017, 17 (3), 2028–2033. 10.1021/acs.nanolett.7b00050. [DOI] [PubMed] [Google Scholar]
Associated Data
This section collects any data citations, data availability statements, or supplementary materials included in this article.


