
Figure 5.
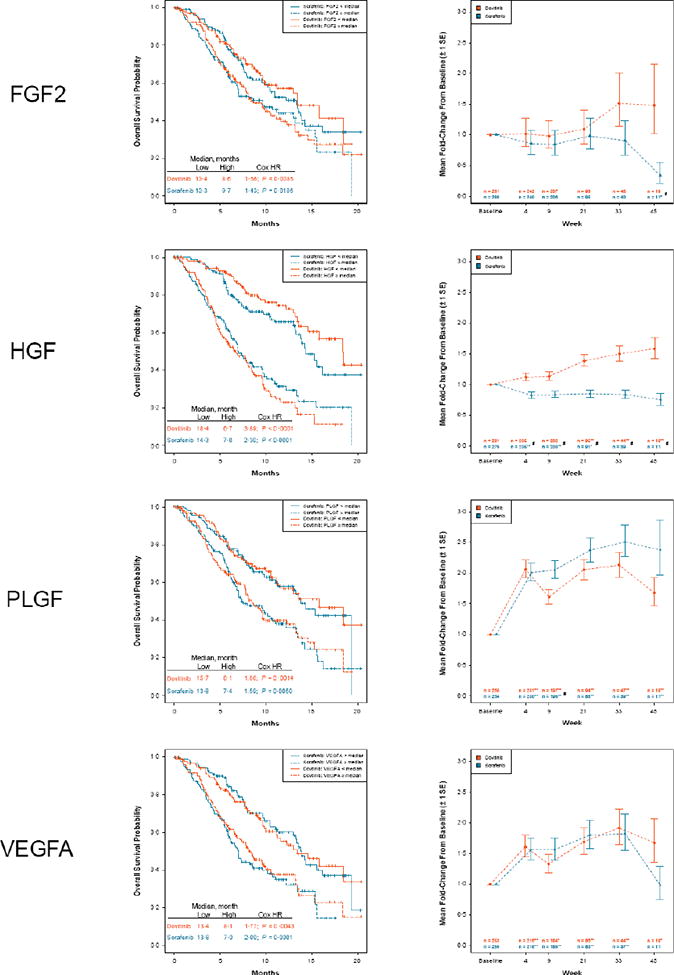
Kaplan-Meier estimates of overall survival by treatment and baseline plasma biomarker groups and model-adjusted average fold-change from baseline ± 1 standard error.
FGF2, fibroblast growth factor 2; HGF, hepatocyte growth factor; HR, hazard ratio; PLGF, placental growth factor; VEGFA, vascular endothelial growth factor A. Low biomarker is defined as < median, and high biomarker is defined as ≥ median. P values are adjusted for the false discovery rate. *0.05 ≥ P > 0.01. **P ≤ 0.01 (change from baseline). #P ≤ 0.05 (dovitinib to sorafenib).