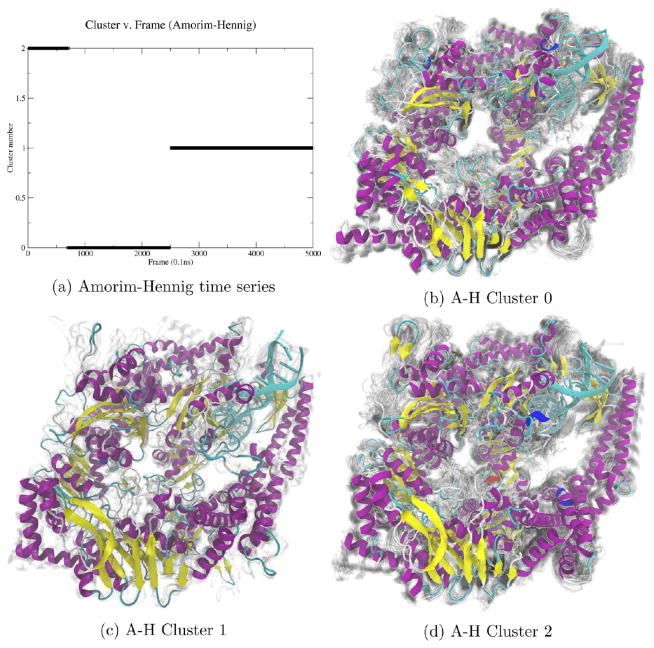
Figure 1.
By plotting the MutSα cluster time series (a), we see Amorim–Hennig splits the first of the two concatenated trajectories into two bins and assigns the second trajectory to the same bin as the initial structure of both simulations. Comparing clusters 0 (b) and 1 (c), we see the overall protein close in on itself. From cluster 0 (b) to 2 (d), we see a β sheet in the upper left form and a loop near the bottom right move away from the larger structure. We see another β sheet near the bottom right of the protein that appears in cluster 1 (c) but not in 0 (b) or 2 (d). The representative (solid) structure in each panel is the frame closest to the average structure by RMSD. The protein is colored by secondary structure in VMD’s102 NewCartoon drawing method: α helices are magenta, β sheets are yellow, π helices are dark blue, and loops are cyan. Nucleic acid is colored all light blue. Shadows are 50 evenly sampled frames from the cluster.

