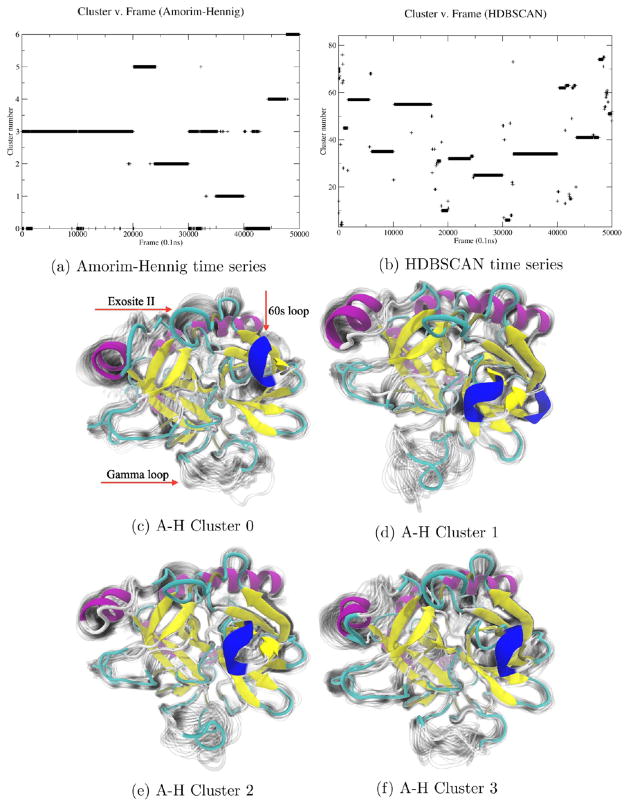
Figure 5.
Amorim–Hennig (a) identified stable states of the system across the five concatenated trajectories. These clusters (c–f) are differentiated primarily by modes of the γ loop, shown at the bottom of each panel: the so-called “60s loop” shown in dark blue at the right of each panel and exosite II shown at the top of each panel. HDBSCAN (b) identified transient states among these stable states (Supporting Information, Figure S4).

