Fig. 3.

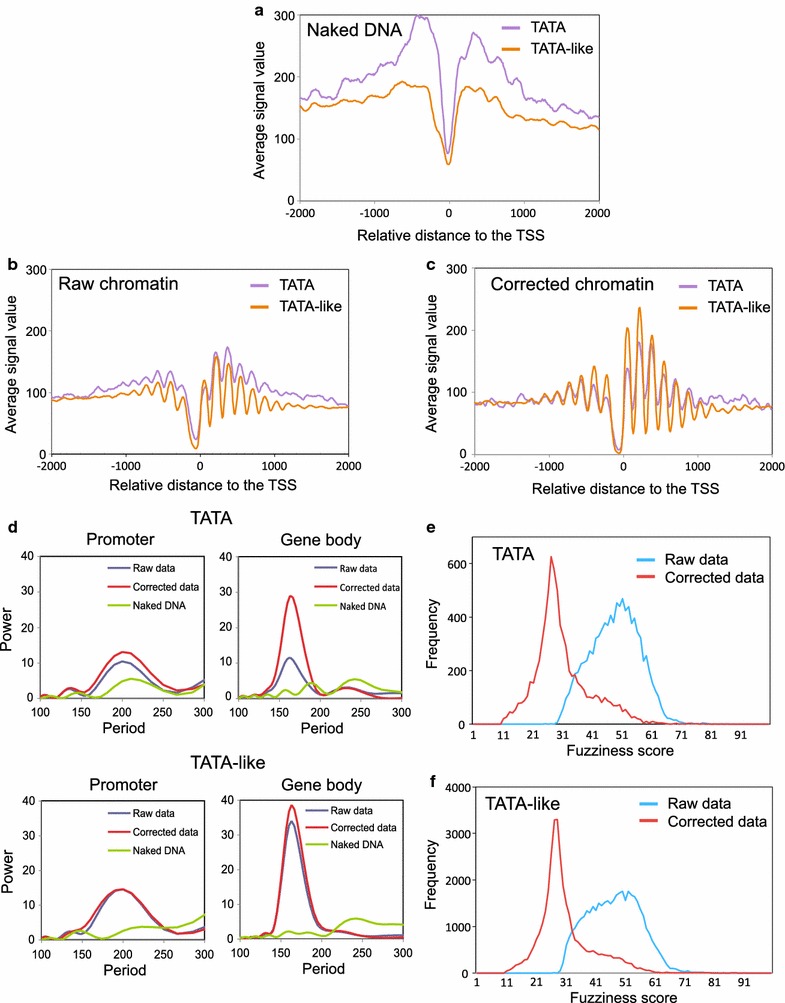
TATA gene bodies are particularly responsive to naked DNA correction. a–c The metagene analysis of the occupancy of the naked (a), raw (b), and corrected (c) data by comparing the TATA (purple) and TATA-like (orange) genes. After classification, genes were aligned to their TSS, as in Fig. 1a. d A spectral analysis of the promoter and gene body nucleosomes of the TATA and TATA-like genes. Details as in Fig. 1c, d. e, f The fuzziness score distribution before (blue) and after correction (red) in the TATA-containing (e) and TATA-like genes (f)
