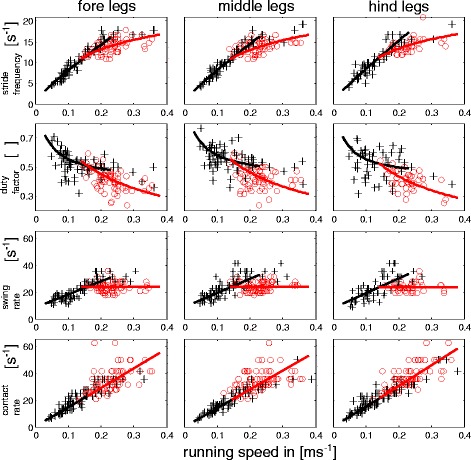
Fig. 5.

Stride frequencies, duty factors, swing rates and contact rates plotted against running speed for all walking legs and non-slippery conditions. First row: Stride frequency (f T); Second row: duty factors (β); Third row: swing rates (t S −1); Fourth row: contact rates (t C −1). Red circles are measured values for runs with metachronal leg coordination while black crosses depict values from alternating tripodal runs. Black and red lines are linear least squares regressions in the third and fourth rows while these regressions were used to calculate the approximation lines in the first two rows (further explanations can be found in the methods section). Red approximation curves refer to metachronal and black to alternating runs
