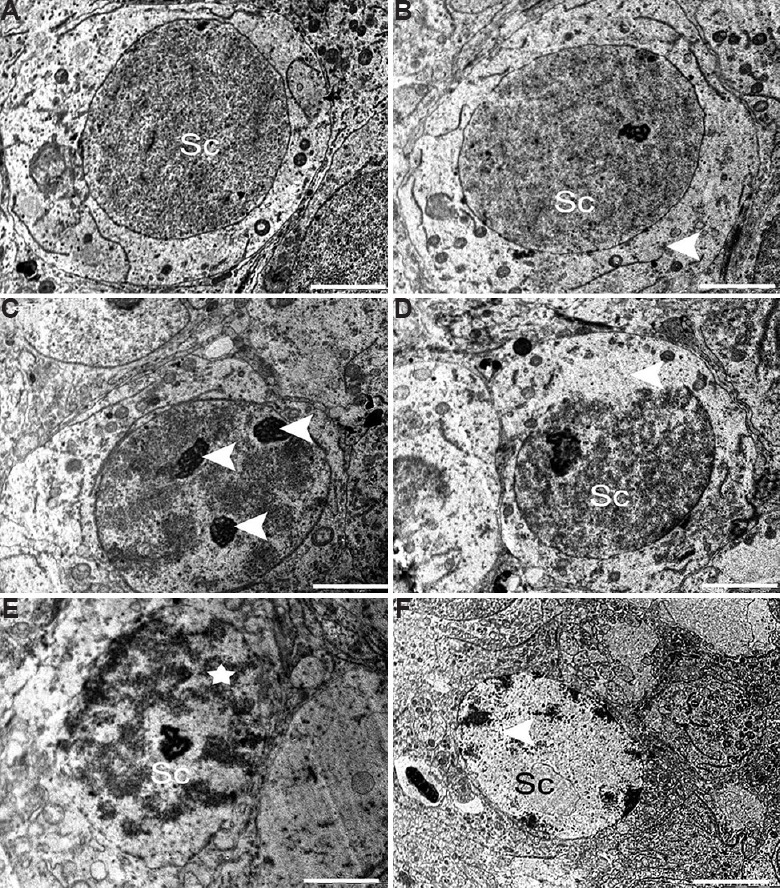
Fig. 10.

Electron micrograph of (A) the spermatocyte (Sc) from control group with prominent well-defined nucleus and intact granular cytoplasm. (B and C) Spermatocyte showing degenerative signs having broken nuclear envelope and lipid droplets (arrowheads) and multi nucleoli (arrowhead) in middle dose group. High-dose group showed (D) Spermatocyte (Sc) with partly missing nuclear membrane (arrowhead), (E and F) apoptotic (star), spermatocyte (Sc), (F) Spermatocyte (Sc) showing chromatin clumping and nuclear vacuolation (arrowhead). Scale bar for all is 0.2 μm except for F is 2 μm.
