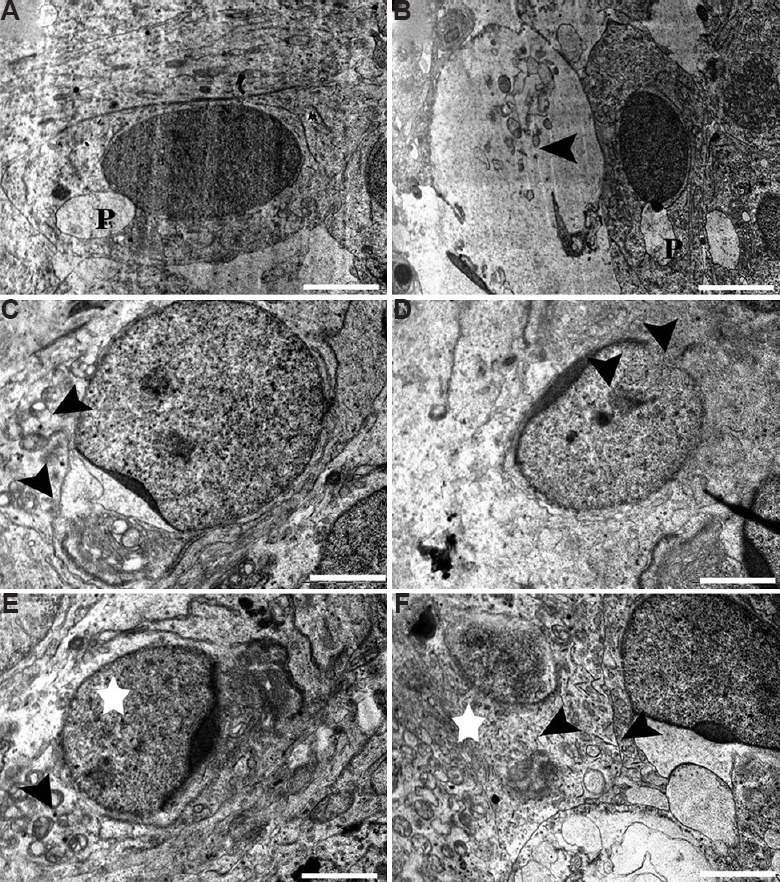
Fig. 12.

Electron micrograph of (A) Healthy elongating spermatids having developing proacrosomal vesicle (P). (B & C) Degenerated spermatids and Sertoli cell components (arrowhead) in middle dose group, (C) abnormal acrosomal vesicle fused with shrunken Golgi complex (arrowhead). (D-F) Condensed granules of chromatin with damaged nuclear envelope (arrowheads) in high-dose group, (E) deformations in mitochondria (arrowhead) and cytoplasm (star) and (F) deformed acrosomal vesicle in elongating spermatid (arrowhead) and degenerative cytoplasm (star). Scale bar for A, B & F is 2 μm and for C-E is 0.2 μm.
