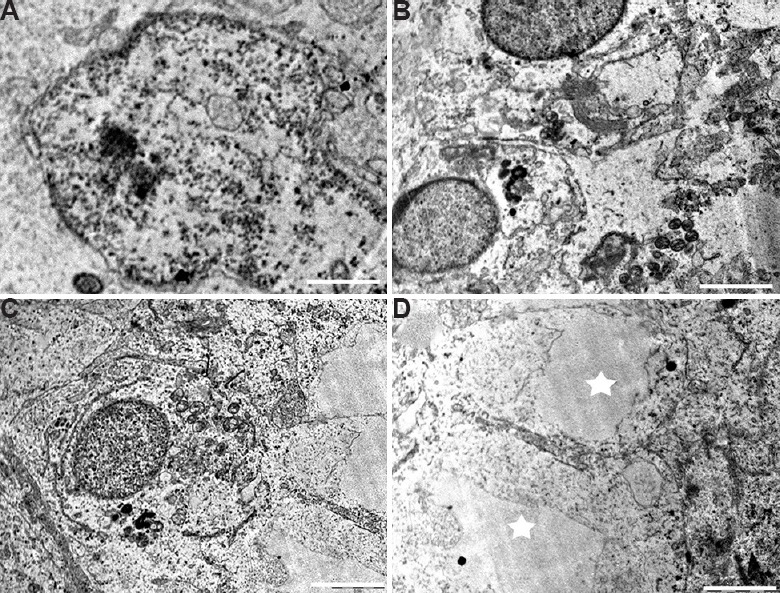
Fig. 7.

Testicular ultrastructure of the Sertoli cell in 25 mg/kg BW/day dose group. (A) Sertoli cell nucleus showing signs of pyknosis. (B and C) Testis ultrastructure showing damaged cellular junctions and germ cells. (D) Highly vacuolated (star) Sertoli cell cytoplasm in high-dose group. Scale bar for all is 2 μm.
