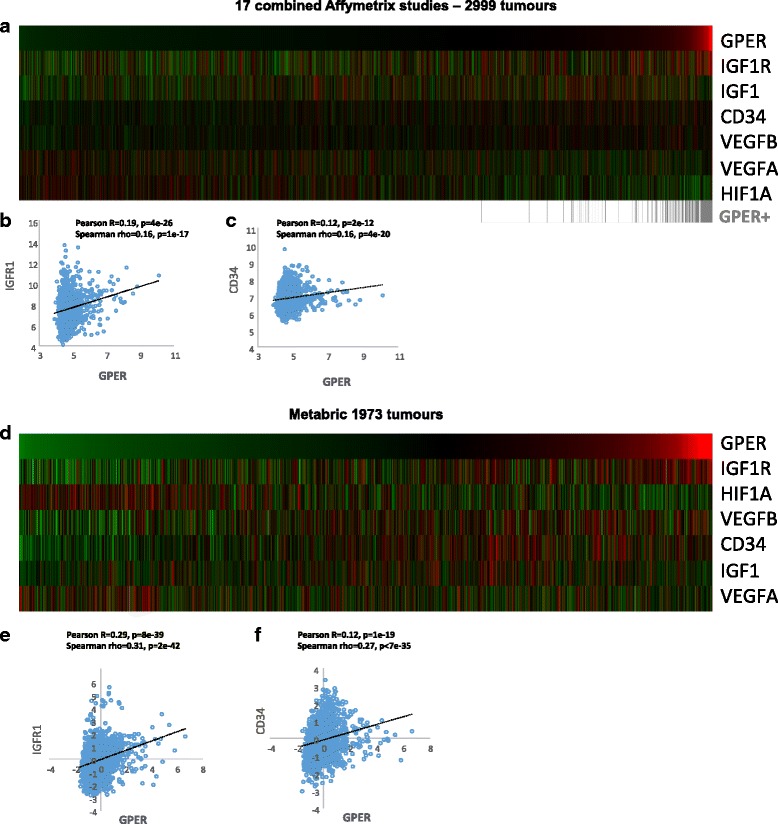
Fig. 1.

GPER correlates with IGF1R and CD34 expression in breast tumor samples. Data showing angiocrine-related genes across the 17 study integrated Affymetrix (a-c) and METABRIC (d-f) datasets of 2999 and 1973 breast cancer patients, respectively. In the heatmaps, ranked from left to right GPER expression correlates with IGF1R and the angiogenic marker CD34. Colors are log2 mean-centered values; red indicates high, and green indicates low. Tumours in which GPER is called ‘present’ (GPER+) using the MAS5 detection calls are indicated in grey. GPER G-protein estrogen receptor, HIF-1 hypoxia inducible factor-1, IGF1 insulin-like growth factor 1, VEGF vascular endothelial growth factor
