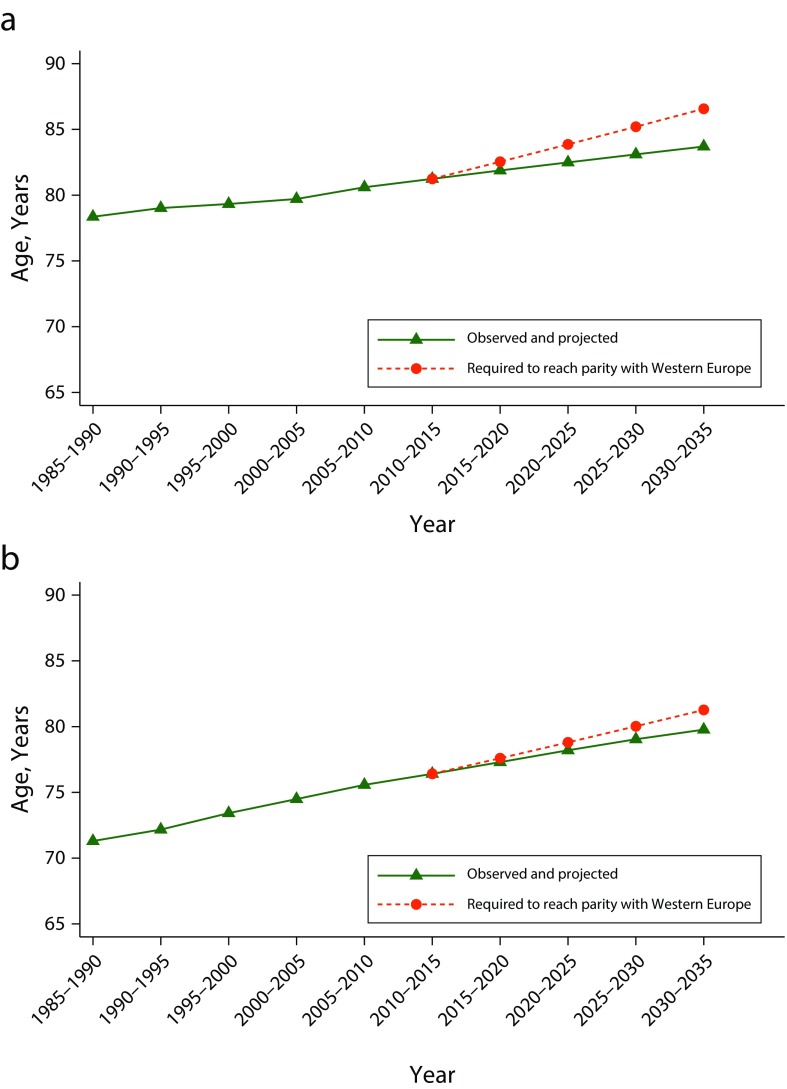
FIGURE 2—
Life Expectancy at Birth by Period, Observed, Projected, and Necessary for Parity Among (a) Women and (b) Men: United States, 1985–2035
Source. United Nations Population Division.4
Note. Estimates following 2010 are United Nations projections. The dashed line represents author calculations of US life expectancy needed to reach United Nations projection of life expectancy in Western European nations in 2030–2035.

