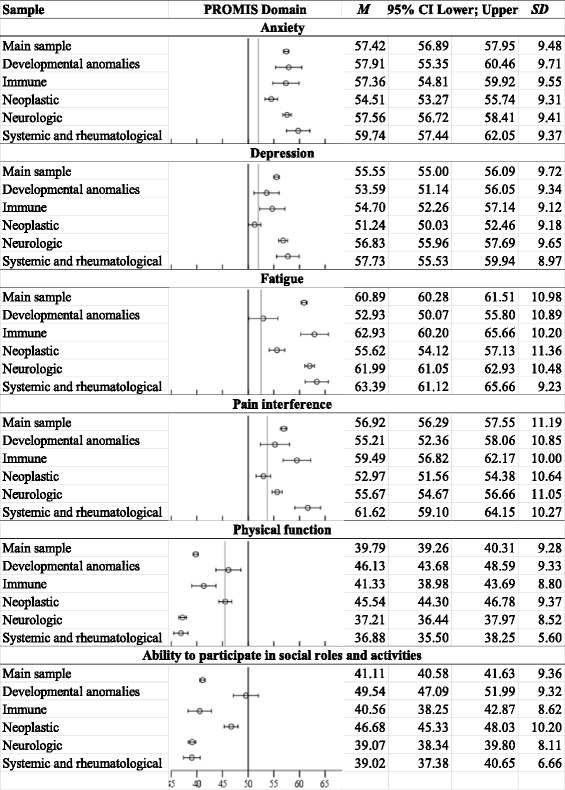
Fig. 1.

PROMIS mean scores for main sample of persons with RD and by RD category. Error bars represent 95% CI. Black lines indicate U.S. population mean, and gray lines indicate means for common chronic diseases. [6, 18] Higher numbers mean higher amounts of the measured construct, so high scores on anxiety, depression, fatigue, and pain interference indicate poor HRQL, while low scores on physical function and ability to participate in social roles and activities means poor HRQL. Main sample n = 1218; neurologic n = 480; neoplastic n = 221; systemic and rheumatological n = 66; developmental anomalies n = 58; and immune n = 56
