
Fig. 2.
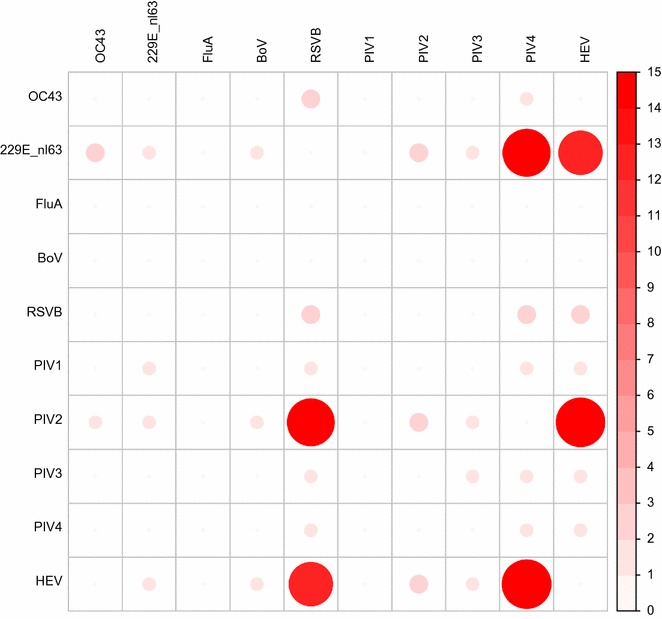
Coinfection distribution of viruses across all samples [coronavirus (OC 229 E/NL63, OC43), influenza A and B (FLUA, FLUB), bocavirus (BoV), respiratory syncytial virus (RSV) A and B, rhinovirus type A-C, and parainfluenza virus 1, 2, 3 and 4 (PIV1–4), enterovirus (HEV), adenovirus (ADV), metapneumovirus (hMPV)]. Shade and size of circle correspond to the number of persons who had both the virus corresponding to the row and column of the cell