Figure 4.

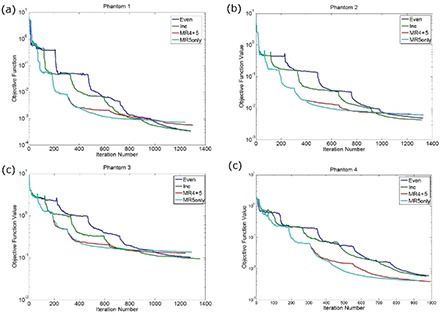
A plot demonstrating the effect of adding an additional 7.5 minutes by pausing the optimization with varying amounts of time in each resolution level for (a) Phantom 1, (b) Phantom 2, (c) Phantom 3, and (d) Phantom 4.

A plot demonstrating the effect of adding an additional 7.5 minutes by pausing the optimization with varying amounts of time in each resolution level for (a) Phantom 1, (b) Phantom 2, (c) Phantom 3, and (d) Phantom 4.