
Figure 5.
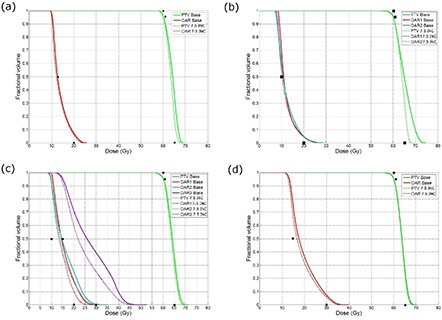
Plots of dose‐volume histograms for plans run with the baseline strategy (solid) as compared to plans generated with the incremental pausing strategy where the total pausing time is 7.5 minutes for (a) Phantom 1, (b) Phantom 2, (c) Phantom 3 and (d) Phantom 4. The black points represent the desired dose‐volume histogram points. The absolute objective function values for each plan and strategy are as follows; vs. for Phantom 1; vs. for Phantom 2; vs. for Phantom 3; vs. for Phantom 4.