Figure 2.

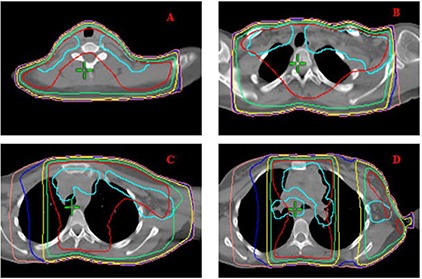
3D CRT isodose distribution of representative axial slices. PTV is shown in cyan. Red, green, yellow, blue, and pink isodose lines represent 21, 19.6, 15, 12, and 10 Gy, respectively.

3D CRT isodose distribution of representative axial slices. PTV is shown in cyan. Red, green, yellow, blue, and pink isodose lines represent 21, 19.6, 15, 12, and 10 Gy, respectively.