Figure 4.

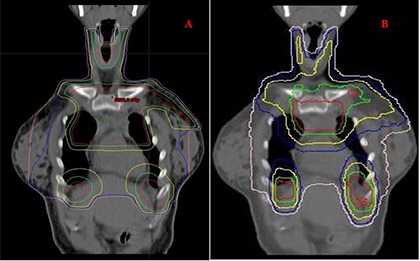
Coronal view showing isodose distributions for a 3D CRT plan (A) and HT plan (B). Red, green, yellow, blue, and pink isodose lines represent 21, 19.6, 15, 12, and 10 Gy, respectively.

Coronal view showing isodose distributions for a 3D CRT plan (A) and HT plan (B). Red, green, yellow, blue, and pink isodose lines represent 21, 19.6, 15, 12, and 10 Gy, respectively.