
Figure 5.
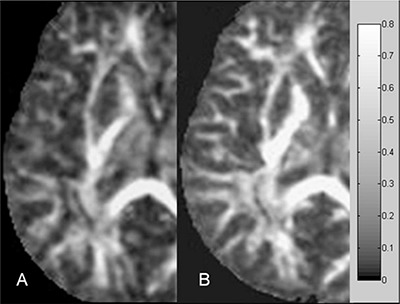
FA maps of the same healthy subject obtained by using DTI acquisition schemes with (A) and (B). The increased contrast between gray and white matter in the image (B) with respect to image A allows a better delineation of the gray‐white matter junction that is recognizable along all the white matter borders. In particular, the improvement of image quality is detectable in the insular circumvolutions where the subcortical “U” fibers are clearly visualized only on image (B).