
Figure 8.
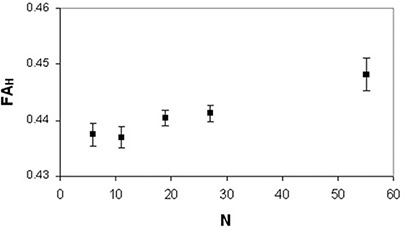
Human brain anisotropy data of a healthy subjects group: values as a function of N.
Official websites use .gov
A
.gov website belongs to an official
government organization in the United States.
Secure .gov websites use HTTPS
A lock (
) or https:// means you've safely
connected to the .gov website. Share sensitive
information only on official, secure websites.
Human brain anisotropy data of a healthy subjects group: values as a function of N.