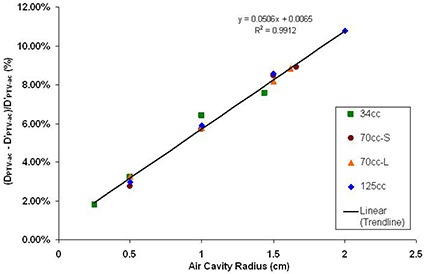
Figure 6.

Air cavity PTV dose comparisons between MCNP5 and TPS model. The x‐axis is the air cavity radius in cm, and the y‐axis is the difference between the two models, calculated by ( – )/ (%). The resulting linear regression line, its equation and are shown with the data points on the graph.
