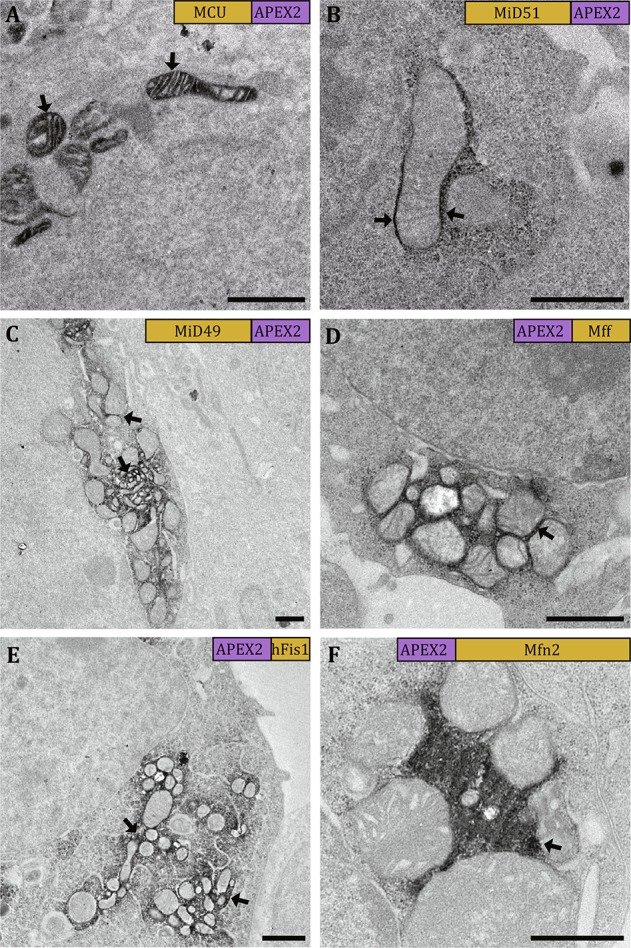
Fig. 2.

Visualizing the staining patterns in 2D by TEM. The micrographs show cells expressing MCU-APEX (A), MiD51-APEX2 (B), MiD49-APEX2 (C), APEX2-Mff (D), APEX2-hFis1 (E), and APEX2-Mfn2 (F). The staining areas with strong EM contrast indicate the locations of the target proteins (black arrows). The labels in the top right corner of each micrograph show the relevant position between the target protein and the tag as well as their relevant sizes. Scale bars, 1 μm
