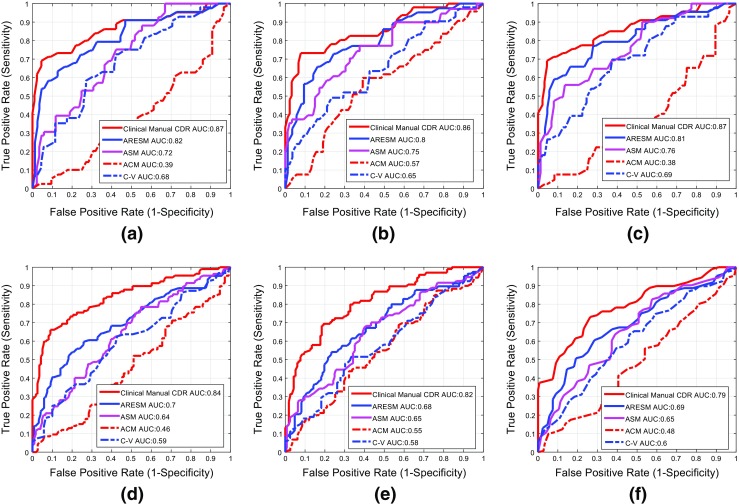
Fig. 15.

Comparison of classification performance between the clinical manual CDR and the automatic CDRs with the first row a, b and c represents the results on set 1 (N vs G) and second row represents the results on set 2 (N vs (G + S)). The first column ((a) and (d)) represent the results calculated on vertical CDR whereas the second and third column represent the results on horizontal CDR and the area CDR respectively
