Figure 1.

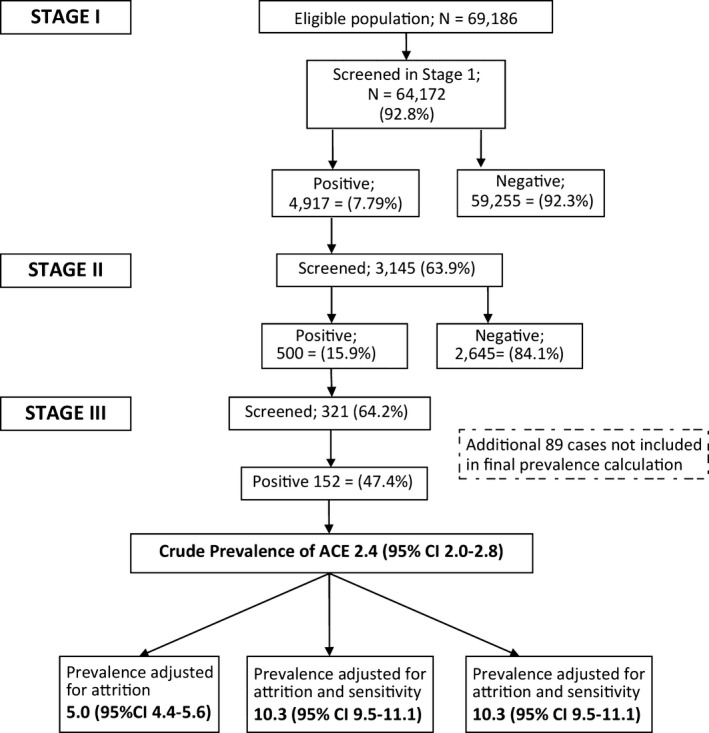
Flow diagram showing selection of study participants and prevalence of active convulsive epilepsy in Iganga‐Mayuge HDSS. ACE‐ active convulsive epilepsy. #On the basis of estimates adjusted for attrition and sensitivity; p = 0.006.

Flow diagram showing selection of study participants and prevalence of active convulsive epilepsy in Iganga‐Mayuge HDSS. ACE‐ active convulsive epilepsy. #On the basis of estimates adjusted for attrition and sensitivity; p = 0.006.