Fig. 8.
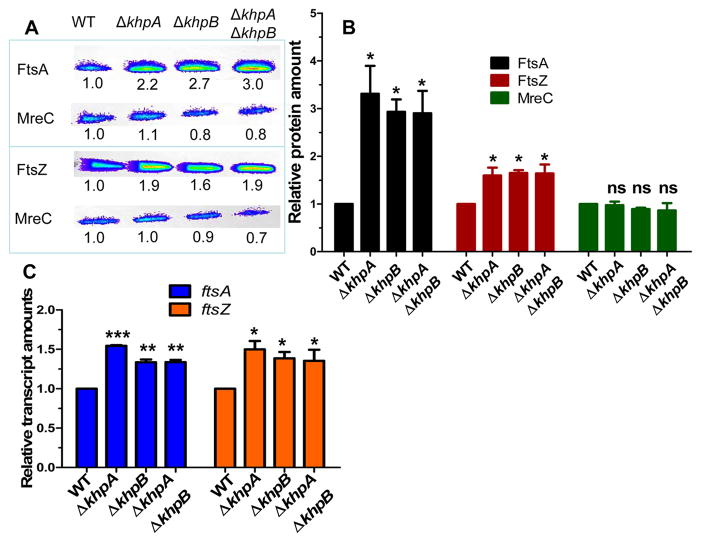
FtsA amount and to a lesser extent FtsZ amount are negatively regulated by KhpA/B. WT (IU1824) and ΔkhpA (IU9036), ΔkhpB (IU10592), and ΔkhpA ΔkhpB (IU10596) mutants were compared. A. Representative Western blots of cellular amounts of FtsA, FtsZ, and MreC (control) in cells growing exponentially in BHI broth. Numbers below lanes are luminescence values relative to WT, determined in the linear range of detection as described in Experimental procedures. B. Average (± SE) cellular amounts of FtsA, FtsZ, and MreC in mutants relative to WT from 3 independent experiments. C. Average (±SE) relative transcript amounts in mutants relative to WT determined by qRT-PCR from 3 independent experiments. For B and C, P values were obtained relative to WT by one-way ANOVA analysis (GraphPad Prism).* P<0.05; ** P<0.01; *** P<0.001; ns: not significantly different.

