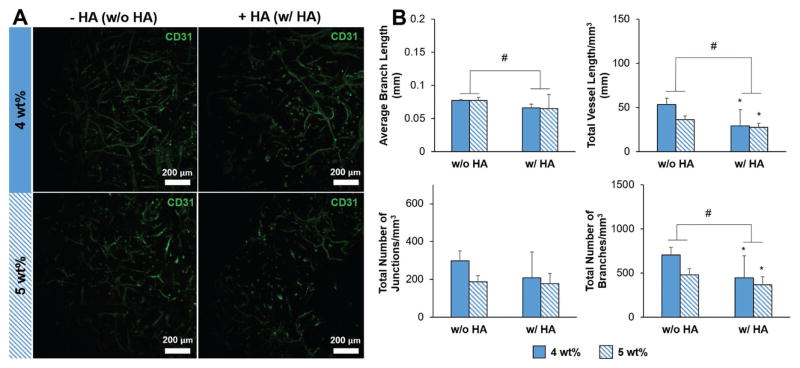
Figure 2.
A) Representative maximum intensity projection images depicting CD31-labeled endothelial cell networks (green) within GelMA hydrogels after 7 d of culture. Scale bar: 200 μm. B) Characterization of endothelial cell network complexity: average branch length, total vessel length mm−3, total number of junctions mm−3, and total number of branches mm−3. Data presented as mean ± SD, n = 6, p-values calculated using one-way ANOVA with Tukey post hoc, #: significant main effect of HA (p < 0.05). The main effect considers only the effect of HA by averaging across 4 and 5 wt% constructs within an HA group. *: significant compared to 4 wt%, no HA GelMA hydrogel (p < 0.05).

