
Figure 3. Distribution of Absolute Lifetime Risk Associated With Modifiable Risk Factors Stratified by Deciles of Nonmodifiable Risk for White Women in the United States.
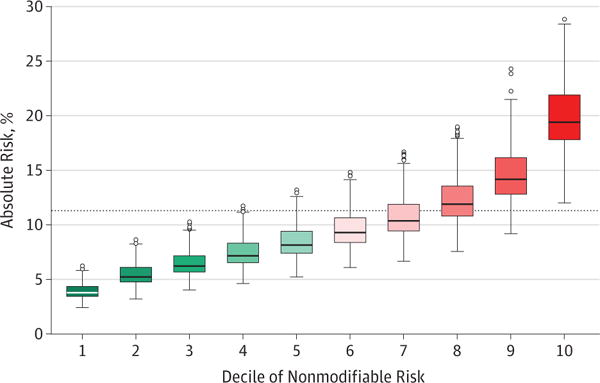
The horizontal line in the middle of each box indicates the median, while the top and bottom borders of the box mark the 75th and 25th percentiles, respectively. The whiskers above and below the box are the minimum and maximum excluding outliers; outliers were defined as individuals who had risk beyond above or below a standard deviation of 3 of means in the log-scale. Lifetime risk refers to cumulative risk between age 30 to 80 years. The dashed line indicates average lifetime risk for the population.