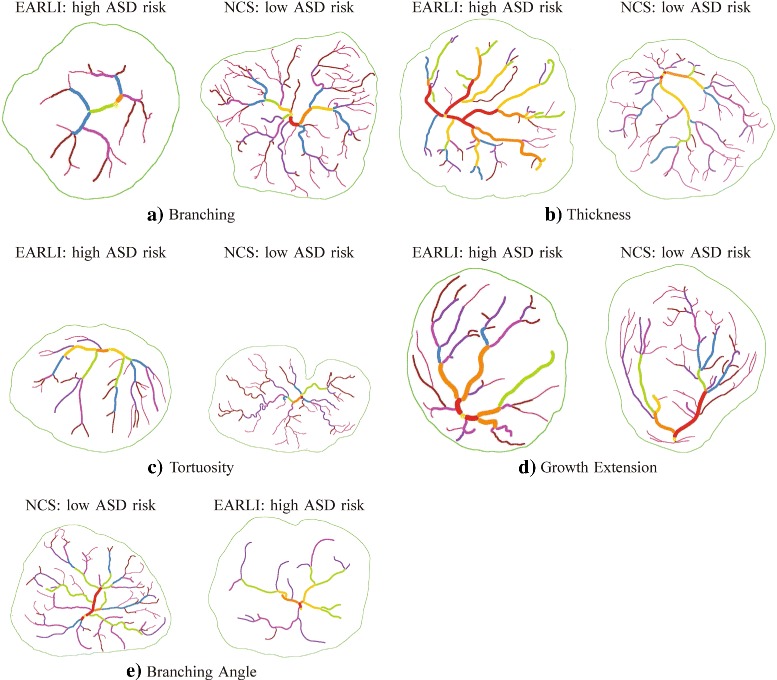
Fig. 6.

Images with the lowest (left) and the highest (right) Principal Component (PC) projection coefficients for the first five PCs. a Principal feature 1: number of branch points. For example, the average number of branch points is 36.74 with a standard deviation of 15.66 in EARLI (left) and 48.48 with a standard deviation of 16.34 in NCS (right). b Principal feature 2: thickness. For example, the average mean thickness is 0.16 with a standard deviation of 0.03 in EARLI (left) and 0.13 with a standard deviation of 0.02 in NCS (right). c Principal feature 3: tortuosity. For example, the average standard deviation of tortuosity is 0.06 with a standard deviation of 0.03 in EARLI (left) and 0.08 with a standard deviation of 0.03 in NCS (right). d Principal feature 4: growth extension. For example, the average mean distance from end points to the nearest boundary point is 2.82 with a standard deviation of 0.48 in EARLI (left) and 2.96 with a standard deviation of 0.41 in NCS (right). e Principal feature 5: branching angle. For example, the average mean branching angle is 102.28 with a standard deviation of 2.87 in NCS (left) and 100.64 with a standard deviation of 3.51 in EARLI (right)
