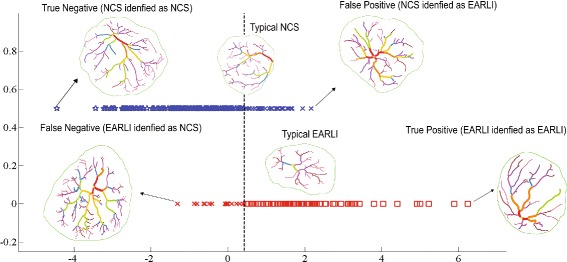
Fig. 7.

A visualization of the Linear Discriminant Analysis (LDA) result. Each placenta in the data set is associated with a dot in the projected space. The vertical dashed line serves as a separation threshold. In the case of a perfect separation, all points on the top line should fall to the left of the threshold while all points on the bottom line should fall to the right of the threshold. The graph illustrates cases for which the classifier has an easier time (True Negative and True Positive) and a harder time (False Positive and False Negative) predicting
