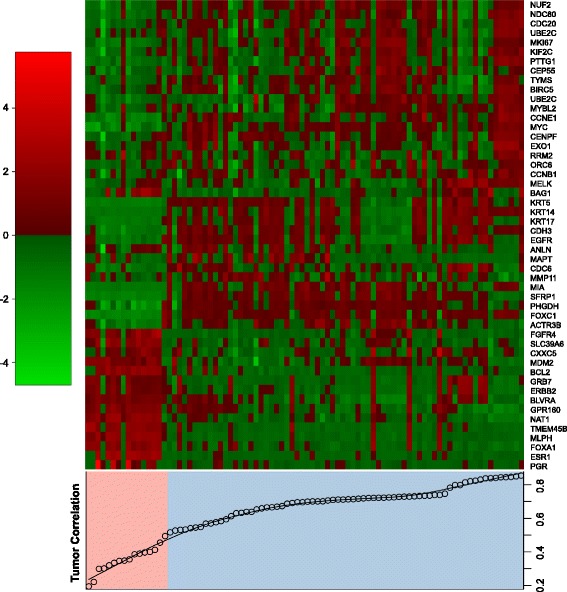
Fig. 3.

Comparisons of intrinsic signature between different xenografts and their corresponding original human tumors. The heatmap represents the intrinsic molecular subtypes based on PAM50, where the genes were clustered in one dimension using complete linkage of Spearman's correlations. When comparing PAM50 gene profiling with the original tumor source, the xenograft tumor samples were split into low (correlation below 0.5, in absolute terms, shaded in pink) and high correlations (above 0.5, shaded in blue) groups
