
Figure 4.
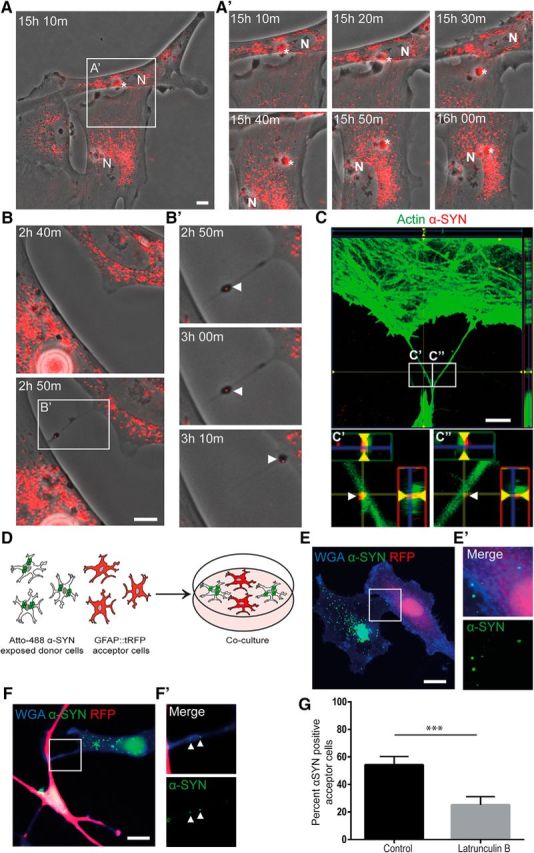
TNTs contribute to α-SYN transmission. Time-lapse experiments of α-SYN-Cy3 oligomer-exposed cultures showed that α-SYN was transported between the astrocytes in the culture via direct contact or via TNTs (see Fig. 4-1A). The different time points after α-SYN oligomer exposure are indicated. Direct transmission by membrane fusion of two astrocytes is shown in A. Close-ups of the cell-to-cell contact region (white rectangle) demonstrate transmission of an α-SYN aggregate (white star) from the top cell to the bottom cell (15 h 20 min to 15 h 30 m after 24 h of α-SYN oligomer exposure) (A′). The α-SYN is then relocated toward the cell nuclei (N). Transfer of α-SYN-Cy3 via TNTs is shown in B. The TNT formation was rather quick and took <10 min (2 h 40 min to 2 h 50 min) (B). Close-up imaging (white rectangle) over the after 20 min demonstrated clear TNT-mediated transfer of aggregated α-SYN (white arrowheads) (B′). Confocal microscopy confirmed the presence of α-SYN in actin-labeled TNTs (C and Fig. 4-1B), close-up of the white rectangles are shown in C′ and C″ (white arrowheads indicate α-SYN). Cocultures of unlabeled astrocytes exposed to Atto 488-labeled α-SYN oligomers and untreated GFAP::tRFP astrocytes (D and Fig. 4-2) demonstrated transfer of α-SYN to unaffected astrocytes via direct transfer (E) and TNTs (F). Close-ups of the cell-to-cell direct contact region and TNTs (white rectangles) are shown in E′ and F′, respectively (white arrowheads in F′ indicate α-SYN). Latruculin B treatment reduced the percentage of α-SYN+ acceptor cells significantly (G). Scale bars: A–C, 10 μm; E, F, 20 μm. Data are presented as mean ± SEM from three independent experiments and the levels of significance were set to *p < 0.05, **p < 0.01, and ***p < 0.001 (G).