
Figure 6.
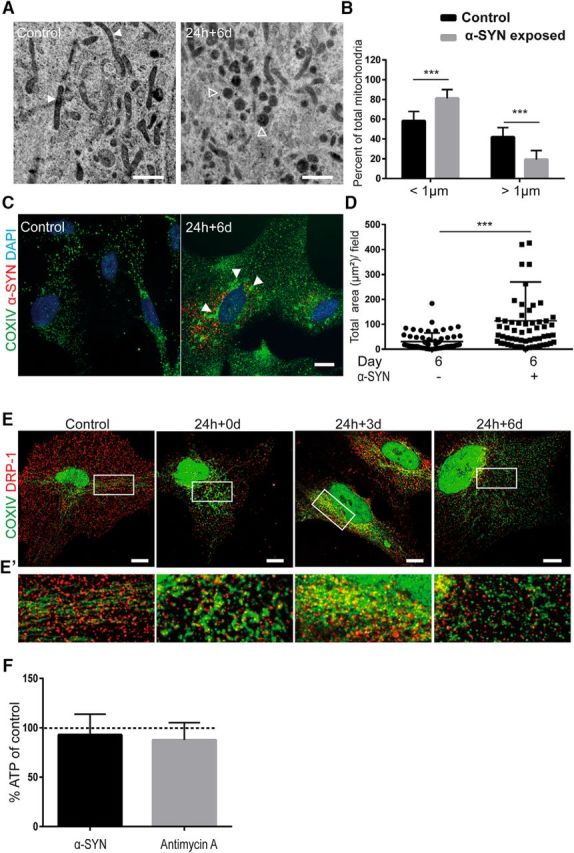
Accumulation of α-SYN oligomers results in mitochondrial defects and autophagy dysfunction. TEM analysis showed widespread mitochondrial fragmentation in α-SYN oligomer-exposed astrocytes compared with control cells (A) (white arrowheads indicate normal mitochondria and empty arrowheads indicate dense/fragmented mitochondria). Quantification of the percentage of normal mitochondria versus dense/fragmented mitochondria using ImageJ demonstrated a significant increase of dense mitochondria in oligomer-exposed cultures (B). Immunostaining with COXIV antibody demonstrated increased formation of mitochondria aggregates (C and Fig. 6-1A, white arrowheads). The increased area of the mitochondria aggregates was confirmed by quantification using ImageJ analysis (D). Double staining with specific antibodies to COX IV and DRP-1 followed by confocal imaging displayed an organized pattern of mitochondria and the fission-regulating protein DRP-1 3 d after α-SYN oligomer exposure (24 h + 3 d), preceding an excessive amount of fragmented mitochondria at day 6 (24 h + 6 d) (E and Fig. 6-1B). Close-ups of the white rectangles are shown in E′. ATP measurement showed only a very moderate decrease (7%) in ATP levels after α-SYN oligomer treatment. In control cultures treated with the electron transport inhibitor antimycin A, there was also a very low decrease in ATP levels (13%) compared with untreated cultures (F). Scale bars: A, 1 μm; C, E, 20 μm. Data are presented as mean ± SD from 14 α-SYN oligomer-exposed and 12 control astrocytes (B) and as mean ± SD from three independent experiments (D). The levels of significance were set to *p < 0.05, **p < 0.01, and ***p < 0.001 (B, D).