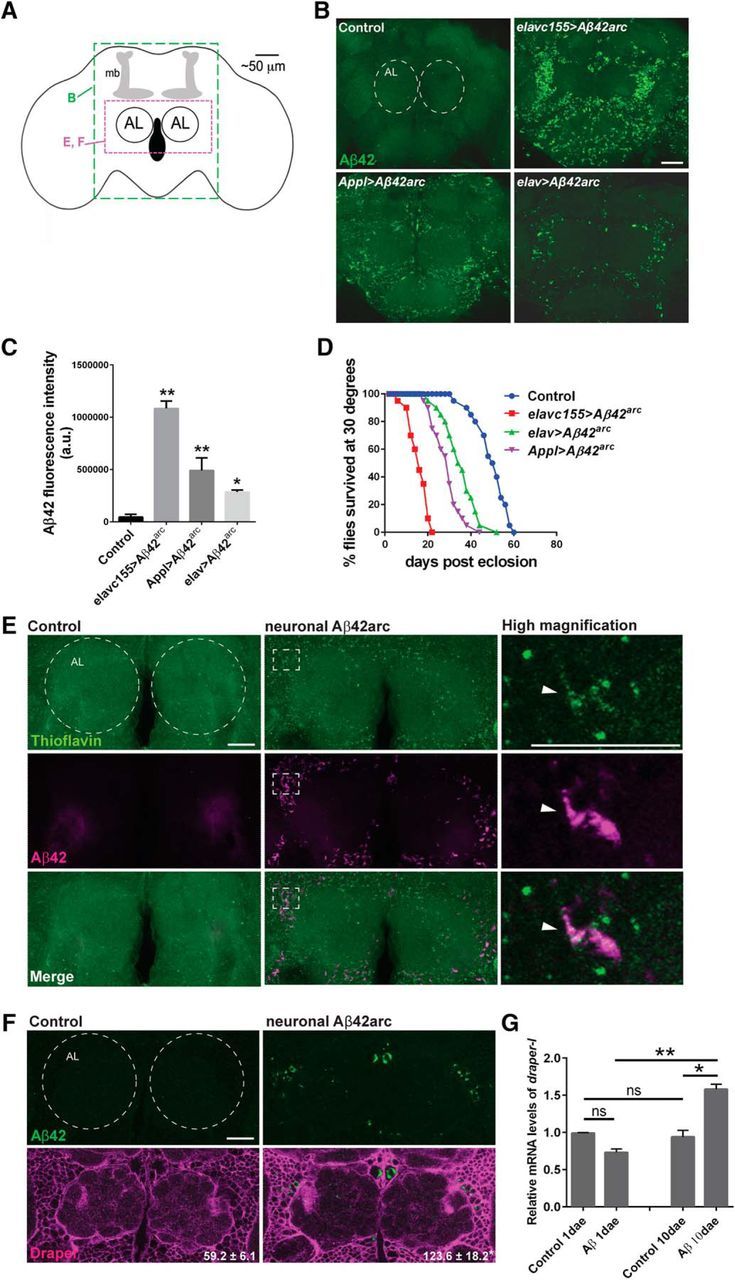
Figure 1.

Glial Draper is upregulated in response to neuronal expression of human Aβ42arc. A, Schematic of the adult Drosophila brain showing relative location of the antennal lobes (AL) and mushroom bodies (mb). Green dotted box corresponds to brain region shown in B. Magenta dotted box shows brain region shown in E and F, and remaining confocal images throughout the paper. B, Representative confocal z-stack projections of adult brains expressing human Aβ42arc under the control of various neuronal drivers. Genotypes: control (elav-Gal4/+), elavc155>Aβ42arc (elavc155-Gal4/+; UAS-Aβ42arc/+), Appl>Aβ42arc (Appl-Gal4/+; UAS-Aβ42arc/+), elav>Aβ42arc (elav-Gal4/+; UAS-Aβ42arc/+); 7-d-old flies immunostained with anti-Aβ. Scale bar, 20 μm. Dotted circles outline the antennal lobes. C, Quantification of Aβ42 fluorescence intensity in central brains of genotypes in A; mean ± SEM. N ≥ 19; F(3,80) = 40.99; *p < 0.05 and ****p < 0.0001; one-way ANOVA with Tukey's post hoc test. D, Lifespan analysis: N = 3 groups of 20 flies, df = 3, p < 0.0001 for each Aβ42arc-expressing strain compared with Control, log-rank (Mantel–Cox) test. E, Z-stack projections of the antennal lobe regions of control (elav-Gal4/+) or neuronal Aβ-expressing (elav-Gal4/+; UAS-Aβ42arc/+) flies immunostained for Aβ (magenta) and incubated with ThT (green). Dotted circles outline the antennal lobes. White dotted rectangle indicates region showing high-magnification images of a single confocal slice. Arrowhead points to representative example of Aβ and ThT puncta colocalization. F, Single confocal slice images of the antennal lobe regions of 10-d-old flies immunostained with anti-Aβ (green) and anti-Draper (magenta). Dotted circles outline the antennal lobes. Quantification of cortical Draper fluorescence intensity in control and Aβ-expressing brains written as mean ± SEM, N ≥ 16, t = 2.809, df = 38; **p = 0.0078; unpaired t test. G, Quantitative PCR analysis of draper-I transcript levels in control and neuronal Aβ-expressing flies 1 and 10 dae; mean ± SEM plotted. N = 20; **p < 0.01, ***p < 0.001, n.s., not significant; one-way ANOVA with Tukey's post hoc test. Scale bar, 20 μm. Genotypes: (elav-Gal4/+) and (elav-Gal4/+; UAS-Aβ42arc/+).
