Figure 2.
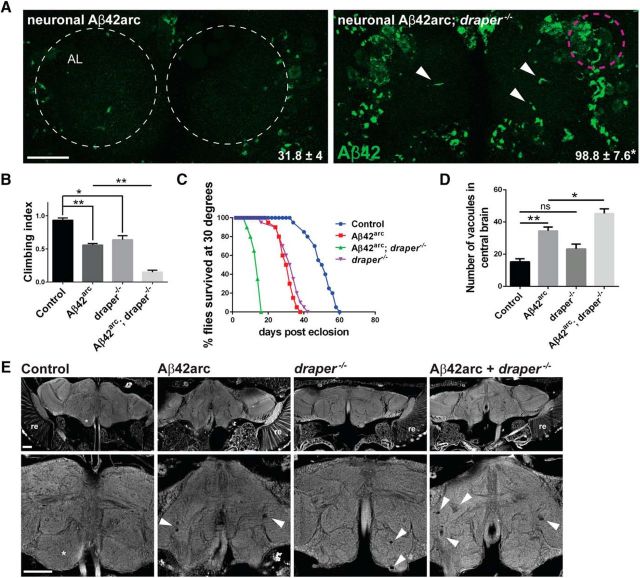
Loss of draper enhances Aβ42arc levels, neurodegeneration, locomotor dysfunction, and reduced lifespan in human Aβ42arc-expressing flies. A, Representative single confocal images of Aβ immunostaining (green) in the antennal lobe regions of the central brain (2 dae) following neuronal expression of Aβ42arc in wild-type (elav-Gal4/+; UAS-Aβ42arc/+) and draper-null (elav-Gal4/+; UAS-Aβ42arc,draper Δ5/ draper Δ5) background. White dotted circles outline the antennal lobes. Magenta circle shows representative region of interest used for quantifying Aβ levels. Arrowheads point to visible Aβ42 accumulation in the central region of the antennal neuropil of draper mutants. Single confocal slice located approximately mid-way through the anterior/posterior boundaries of the antennal lobes. Quantification of Aβ42 fluorescence intensity in the cortex region adjacent to neuropil regions written as mean ± SEM. N = 20, t = 7.823, df = 38; ****p < 0.0001; unpaired t test. B, Quantification of locomotor climbing index of following genotypes: control (elav-Gal4/+), neuronal Aβ42arc (elav-Gal4/+;UAS-Aβ42arc/+), draper-null (draperΔ5/ draperΔ5), and neuronal Aβ42arc, draper-null flies (elav-Gal4/+; UAS-Aβ42arc,draperΔ5/ draperΔ5); mean ± SEM plotted. N = 3 groups of 20 7-d-old flies; F(3,8) = 71.91; **p < 0.01, ****p < 0.0001; one-way ANOVA with Tukey's post hoc test. C, Lifespan analysis of the genotypes shown in B. N = 3 groups of 20 flies, df = 3. Control versus neuronal Aβ42arc flies: p < 0.0001. Control versus draper-null flies: p < 0.0001. Neuronal Aβ42arc versus neuronal Aβ42arc, draper-null flies: p < 0.0001; log rank (Mantel–Cox) test. D, Quantification of vacuoles in central brain region of 7-d-old flies. N ≤ 10 flies for each genotype; mean ± SEM plotted. F(3,57) = 25.34; *p < 0.05, ****p < 0.0001; one-way ANOVA with Tukey's post hoc test. Genotypes same as in B and C. E, Representative images of 7 μm paraffin sections used for quantification in D. Arrowheads point to vacuoles indicating neurodegeneration. Asterisks indicate antennal lobe region. re, Retina. Scale bar, 20 μm.

