Figure 4.
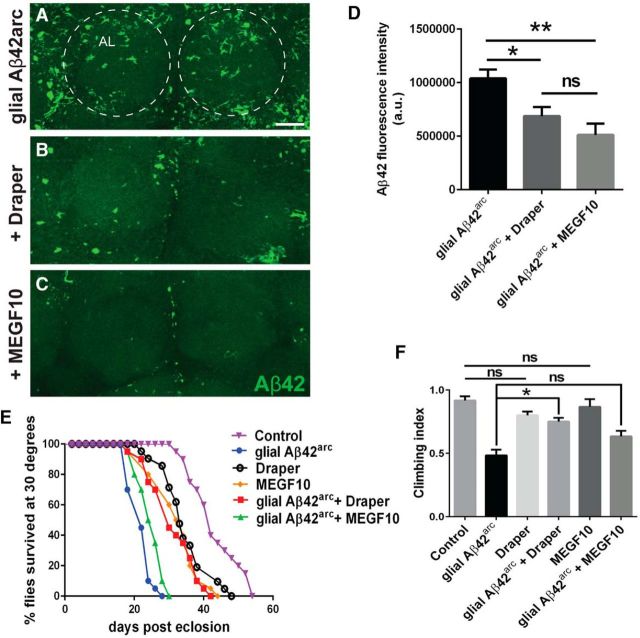
Overexpression of Draper/MEGF10 reverses Aβ accumulation, locomotor defects, and reduced lifespan in Aβ42arc-expressing flies: A–C, Z-stack images of anti-Aβ stained brains expressing glial Aβ42arc (UAS-Aβ42arc/+; repo-Gal4/+), coexpressing glial Aβ42arc and Draper (UAS-Aβ42arc/UAS-Draper-I; repo-Gal4/+), or glial Aβ42arc and mouse MEGF10 (UAS-Aβ42arc/+; repo-Gal4/UAS-MEGF10); 7-d-old flies. Dotted circles outline antennal lobes. D, Quantification of Aβ42 fluorescence intensity for experiments shown in A–C; mean ± SEM plotted. N ≥ 16; F(2,49) = 7.907; *p < 0.05, ***p < 0.001; one-way ANOVA with Tukey's post hoc test; n.s., not significant; a.u., arbitrary units. E, Lifespan analysis: N = 3 groups of 20 flies; df = 5; glial Aβ versus glial Aβ + Draper flies: p < 0.0001; glial Aβ versus glial Aβ + MEGF10 flies: p < 0.05; Control versus Draper: p < 0.001; Control versus MEGF10: p < 0.0001; log rank (Mantel–Cox) test. Genotypes: Control (repo-Gal4/+), glial Aβ42arc (UAS-Aβ42arc/+; repo-Gal4/+), Draper (UAS-Draper-I/+), MEGF10 (UAS-MEGF10/+), glial Aβ42arc + Draper (UAS-Aβ42arc/UAS-Draper-I; repo-Gal4/+), and glial Aβ42arc + MEGF10 (UAS-Aβ42arc/+; repo-Gal4/UAS-MEGF10). F, Negative geotaxis climbing assay results (20-d-old flies); mean ± SEM plotted. N = 3 groups of 20 flies; F(5,12) = 14.97; **p < 0.01; n.s., not significant; one-way ANOVA with Tukey's post hoc test. Genotypes same as in E. Scale bar, 20 μm.

