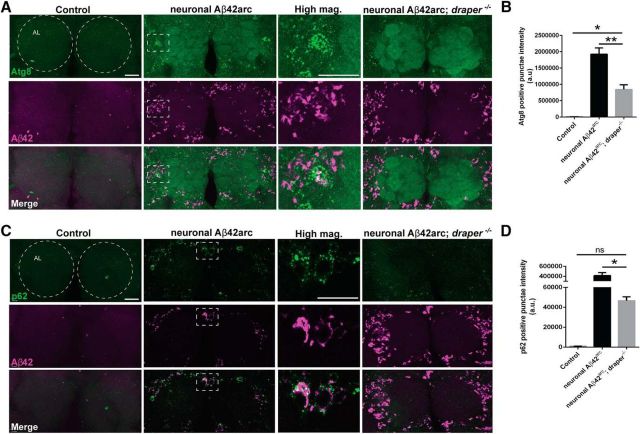
Figure 6.
Human Aβ42 expression induces Draper-dependent activation of Atg8 and p62 in the adult fly brain. A, Representative confocal images of brains immunostained for Atg8 (green) and Aβ42 (magenta). Area of high-magnification image is indicated with dotted white box. Circles outline antennal lobes (AL). Control (elav-Gal4/+), neuronal Aβ42arc (elav-Gal4/UAS-Aβ42arc), and neuronal Aβ42arc; draper (elav-Gal4/+; UAS-Aβ42arc,draperΔ5/ draperΔ5). B, Quantification of Atg8 fluorescence in A. Total Atg8 fluorescence intensity in the cortical regions adjacent to the antennal lobe neuropil was measured; mean ± SEM, plotted. N ≥ 15; F(2,45) = 44.97; ***p < 0.001, ****p < 0.0001; one-way ANOVA with Tukey's post hoc test; a.u., arbitrary units. C, Representative images of brains immunostained for p62 (green) and Aβ42 (magenta). Regions corresponding to high-magnification images are indicated with dotted white box. Control (elav-Gal4/+), neuronal Aβ42arc (elav-Gal4/UAS-Aβ42arc), and neuronal Aβ42arc; draper (elav-Gal4/+; UAS-Aβ42arc,draperΔ5/ draperΔ5). D, Quantification of p62 fluorescence shown in C. Total p62 fluorescence was quantified from the cortical regions adjacent to the antennal lobes; mean ± SEM, plotted. N ≥ 13; F(2,39) = 44.70; ****p < 0.0001; n.s., not significant; one-way ANOVA with Tukey's post hoc test; a.u., arbitrary units. Scale bars, 20 μm. Atg8- and p62-positive structures range from 0.1 to 1.5 μm. Average neuronal cell body size in the central brain is 3.1 ± 0.4 μm. All confocal images are 24 μm projections.

