Figure 5.

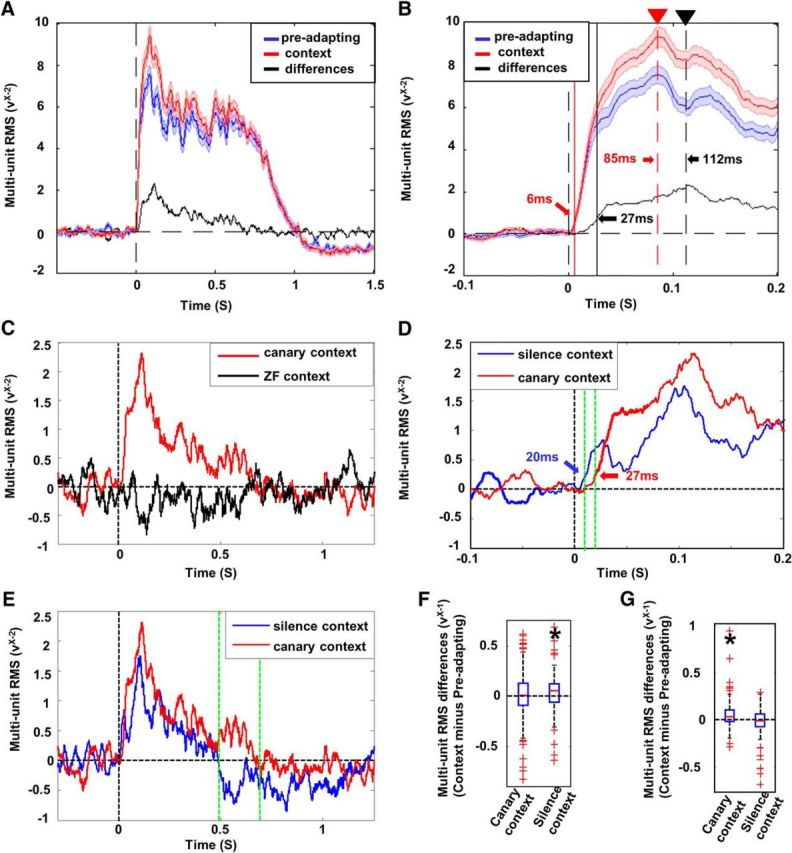
Response latency and timing of response enhancement. A, Enhancement profile (black trace) for the canary context is displayed as the difference between the averaged response waveforms for the test song in the preadapting phase (blue trace) and the context-modulated phase (red trace). Shaded areas along the traces show SEs. The vertical dashed line indicates the onset of the stimulus. B, Early phase of the averaged response waveforms and the enhancement profile for the canary context condition from A but at a finer time scale. The solid vertical lines indicate the latency of responses from stimulus onset (red) and the latency of the enhancement profile (black; 21 ms later than the red line). The latency was computed as the time from stimulus onset until the signal crossed a threshold, computed as the maximum value of the 99% confidence interval for each signal during the baseline window. Dashed red line with triangle indicates the peak of the response (85 ms after stimulus onset). The arrow and dashed black line with triangle indicate the peak of the enhancement profile (112 ms after stimulus onset). Both the latency and the peak of the enhancement profile occur later than the latency and the peak of the responses. C, Comparison between the enhancement profiles for the canary context condition (red trace) and for the ZF context condition (black trace). The ZF context condition shows no clear enhancement effect (note: gain is higher than in A). D, Comparison of the early phase of the enhancement profiles in the canary context condition (red trace) and in the silence context condition (blue trace) showing a shorter latency of the enhancement effect in the silence context condition. The green dashed lines indicate the window 10–20 ms after the stimulus onset, in which significant enhancement was observed in the silence context condition, but not in the canary context condition (also see F). E, Comparison between the enhancement profiles in the canary (red trace) and the silence context condition (blue trace) showing a shorter duration for the enhancement profile in the silence context condition. The green dashed lines indicate the window 490–690 ms after the stimulus onset, when the profile for the silence context condition decays to zero but the enhancement effect is still significant for the canary context condition (also see G). F, Box plot of multiunit RMS differences between the preadapting phase and the context-modulated phase in the window 10–20 ms after the stimulus onset (between dashed green lines in D) was compared between the canary context and the silence context. There was a significant increase in response amplitude in this time window in the silence context (left box; Wilcoxon z = 2.8; p < 0.006, n = 98), but not in the canary context (right box; Wilcoxon z = 1.5; p > 0.123, n = 98). G, Box plot of multiunit RMS differences between the preadapting phase and the context-modulated phase in the window 490–690 ms after the stimulus onset (between dashed green lines in E) was compared between the canary and silence contexts. There was a significant increase in response amplitude in this time window in the canary context (left box; Wilcoxon z = 6.90; p < 0.001, n = 98), but not in the silence context (right box; Wilcoxon z = −1.24; p > 0.216, n = 98).
