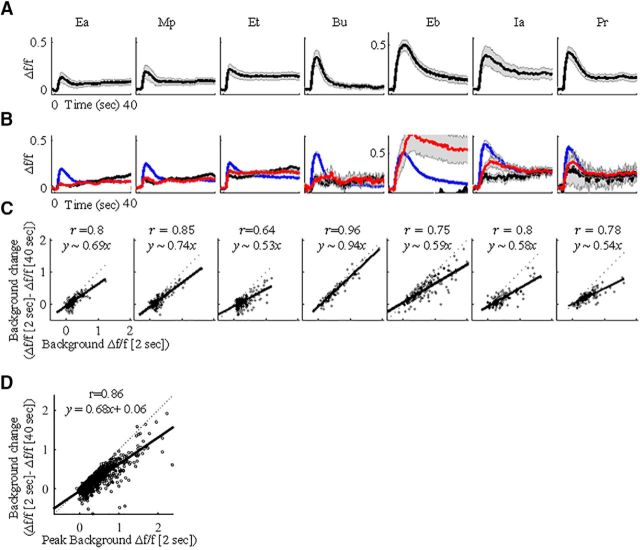
Figure 2.
MCs adapt to background in an intensity-dependent manner. A, MC responses to seven different background odors (duration, 40 s). Black, Mean traces; gray, SEM. B, Same responses as in A only separated by classification: adapting, blue; no change, red; rising, black. C, Linear correlations between background intensity at the peak (peak at 2 s, x-axis) and after background change (peak at 2 s − peak at 40 s, y-axis), per odor. Black curves reflect the linear regression equation on the top. Dotted line here and throughout the manuscript is when x = y. D, Linear correlations between background intensity and background change, combined for all odors.

