Figure 4.
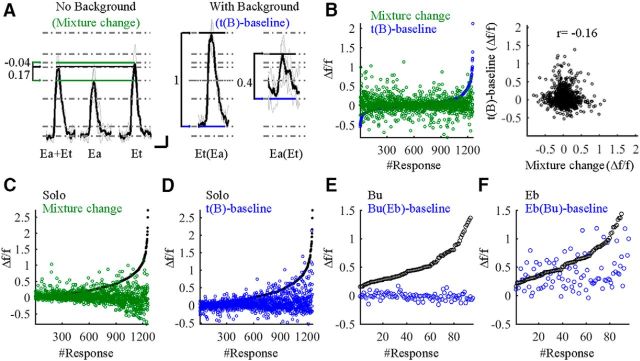
Mixture processing is modulated in the face of background. A, Representative example of a MC, which was more sensitive to a target odor when background odor was present. The traces show the responses of this MC to five stimuli [Ea, Et, Ea+Et, Et(Ea), and Ea(Et)]. The gray dotted lines are references to baselines and response amplitudes denoting the changes in activation from one state to the next (arrows). For example, the transition from Ea to Ea+Et induces a 0.17 Δf/f change in fluorescence (Mixture change; bottom green to black line). However, the response during background to the exact same stimulus was a change of 1 Δf/f [t(B)-baseline; blue to black line in the Et(Ea) responses]. Similarly, the transition from Et to Ea+Et was a small decrease of −0.04 Δf/f while a 0.4 Δf/f increase was observed when background was present [Ea(Et)]. B, Left, Scatter plots of t(B)-baseline for all odors sorted by their amplitude (blue) and the mixture change for the same odor combination in the same cell (green). Right, Plot of the correlations between mixture change (x-axis) and the change for the same mixture but when one odor is the background [t(B)-baseline, y-axis]. C, Scatter plot of responses to the solo odor (black; sorted by amplitude) and the change in the mixture response by the same cell (green). Higher responses have lower mixture change (y = −0.3x + 0.3, r = −0.2). D, Same as C but blue is the t(B)-baseline response. Here, higher responses do not show negative but rather more positive response changes (y = 0.5x + 0.3, r = 0.3). E, F, Same as in D but only for the odors Bu and Eb. In E, Bu versus Bu(Eb) (y = −0.04x + 0.01, r = −0.26), and in F, Eb versus Eb(Bu) (y = 0.36x + 0.17, r = 0.43). Note that background effects are not symmetric. See main text for details.

