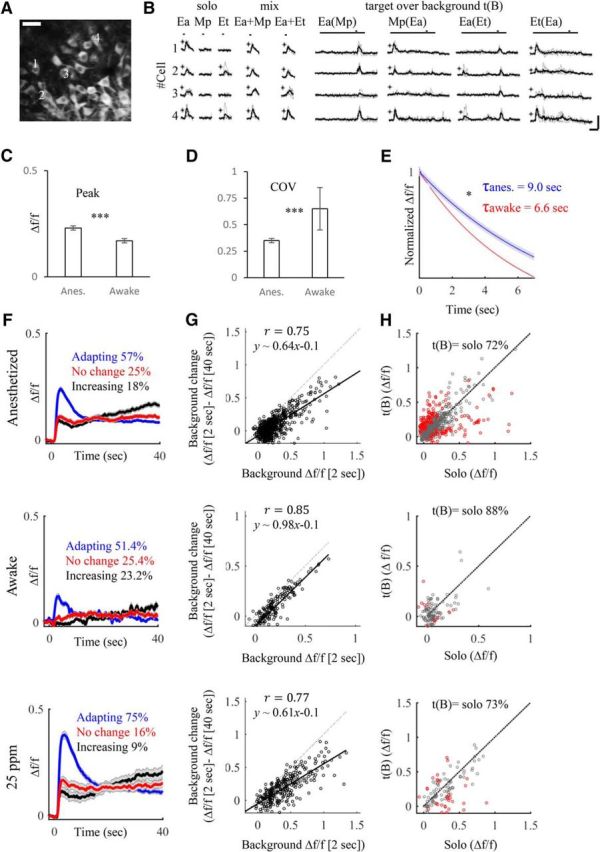
Figure 5.

MC responses to t(B) in low-concentration and awake mice. A, B, Similar to Fig. 1A,B but in head-restrained awake mice. C, Average of peak amplitude responses in awake and anesthetized mice. ***p = 9.6 × 10⁻⁸, t test. D, Average of the coefficient-of-variance (COV) values in awake and anesthetized mice. ***p = 1.8 × 10⁻⁸, t test. E, Average decay time from peak amplitudes to steady state in the awake (red) and anesthetized (blue) states, normalized to the peak. *p = 0.04, t test. Gray, SEM between different mice. F–H, Side-by-side comparison of various response values using the same odor set to three different experimental conditions. Top, 250 ppm (anesthetized); middle, awake mice; bottom, 25 ppm (anesthetized). F, Average traces of the adapting (blue), the stable (red), and the increasing (black) MC responses along a 40 s background stimulus. G, Linear correlations between background intensity at the peak (peak at 2 s, x-axis) and after background change (peak at 2 s − peak at 40 s, y-axis). H, Top, Scatter plot comparing the maximum calcium response of the target alone (solo; x-axis) to the target [t(B); y-axis]. Each data point is one cell–odor pair. Gray, Responses are not significantly different; red, responses are significantly different (unpaired 2-sample t test, p < 0.05). Middle, Same for awake mice. Bottom, 25 ppm concentration. On top of each graph is the percentage of gray dots from the total number of responses.
