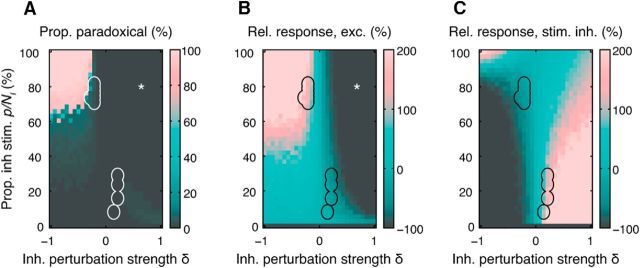
Figure 8.
Paradoxical effects under simulated optogenetic perturbation. A, Responses to perturbation in an ISN regime network indicating the proportion of excitatory neurons that exhibit a paradoxical effect in the net inhibitory input currents as a function of perturbation strength δ and proportion p of inhibitory neurons perturbed. B, C, Relative change in excitatory (B) and stimulated inhibitory (C) neuron activity for the same simulations as in A. We considered that a paradoxical effect was visible when the input currents changed by at least 10% in the appropriate direction. Outlined regions in A–C indicate responses to perturbation where changes in excitatory and inhibitory activity are approximately equal to those reported by Atallah et al. (2012) (see Materials and Methods). *Region where the majority of excitatory neurons are below threshold, leading to failure of excitatory-driven inhibition. Parameters: {wE, wI, hEE, hEI, hIE, hII, NE, NI} = {4, 100, 6.4 × 10⁻³, 0.21, 0.24, 0.99, 4800, 1200}.

