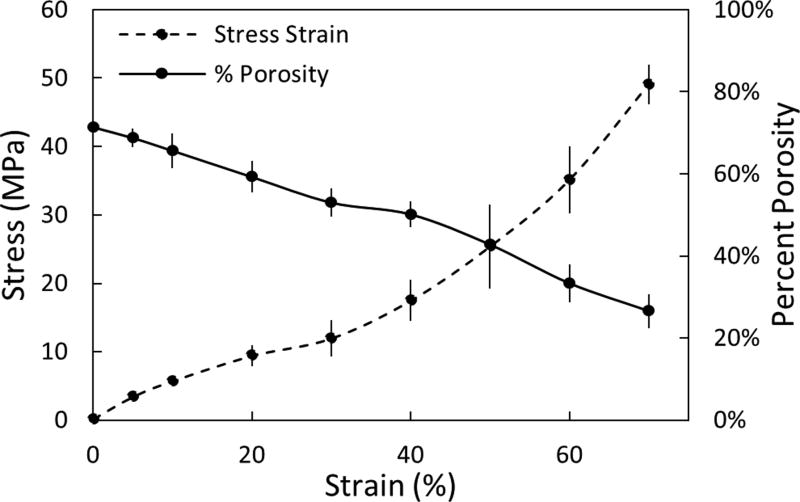
Figure 2.
Microstructural response of porous PEEK to compression. Plot of percent porosity versus strain (solid line) with the stress-strain plot included for comparison (dashed line). Mean ± SE. (Adapted from Evans, 201737 with permission from Elsevier.)

