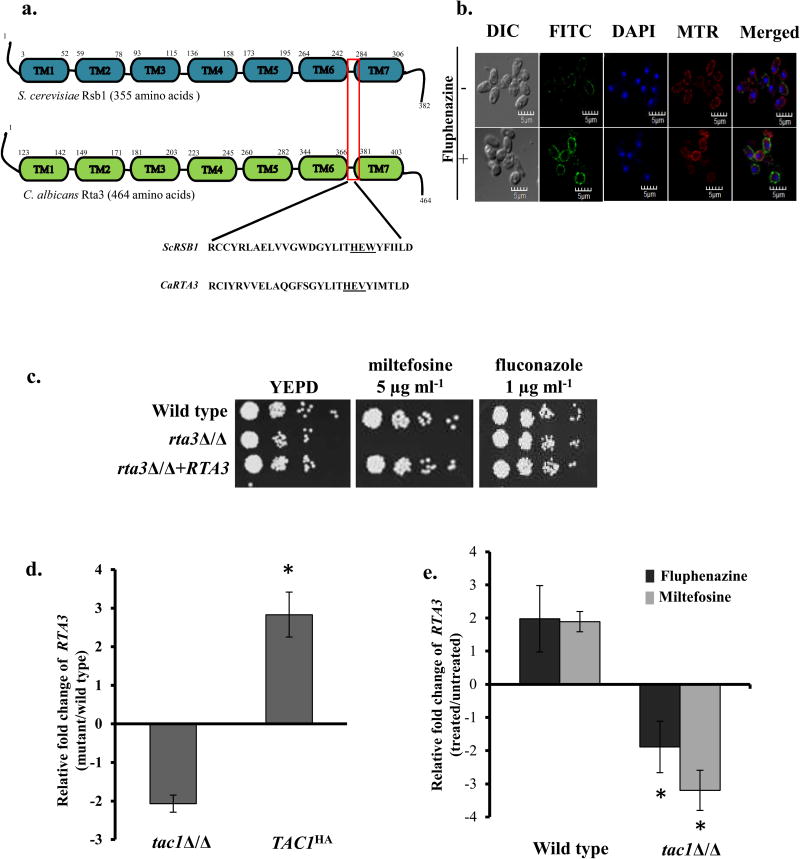
FIGURE 1. Rta3p is localised to the plasma membrane and is required for miltefosine tolerance.
(a) Schematic representation of the conserved transmembrane domain structure of C. albicans Rta3 and S. cerevisiae Rsb1. The red box indicates the 28 amino acid signature sequence of the Rta1-like family of proteins in the region spanning TMS6 and TMS7. Underlined amino acids represent conserved His-Glu-Tyr/Trp motif within the ScRSb1 sequence. The Tyr is replaced with a Val in CaRTA3. Abbreviations: TM, transmembrane. (b) Indirect immunofluorescence of Rta3-Myc in the wild type strain grown in the absence and presence of 20 µg ml−1 of fluphenazine. Cells were grown in YEPD till OD600 1 and treated for 30 min with 10 µg ml−1 fluphenazine before visualization. DIC represents phase images and FITC represents Rta3-Myc staining. Co-staining with DAPI and MitoTracker™ Red (MTR) is also shown. Approximately 200 cells were visualized using confocal microscopy (c) Fivefold serial dilutions of cell suspensions were spotted onto YEPD plates supplemented with miltefosine and fluconazole and incubated at 30 °C for 48 h. (d) qPCR based expression analysis of RTA3 in tac1Δ/Δ and TAC1HA cells. Fold change (mutant/wild type) is calculated by 2−ΔΔCT, and normalised to ACT1 (endogenous control), with the wild type strain as a calibrator. Values are mean ± S.D and are derived from three independent experiments. Fold change in TAC1HA is statistically significant compared to tac1Δ/Δ, *P <0.01, Student’s t-test. (e) qPCR based expression analysis of RTA3 in wild type and tac1Δ/Δ strain treated with fluphenazine (10 µg ml−1, 30 min) and miltefosine (5 µg ml−1, 120 min) The drugs were added to the secondary culture at an OD600 of 1. Values are mean ± S.D and are derived from three independent experiments. Fold change in drug treated tac1Δ/Δ is statistically significant compared to drug treated wild type, *P <0.01, Student’s t-test.

