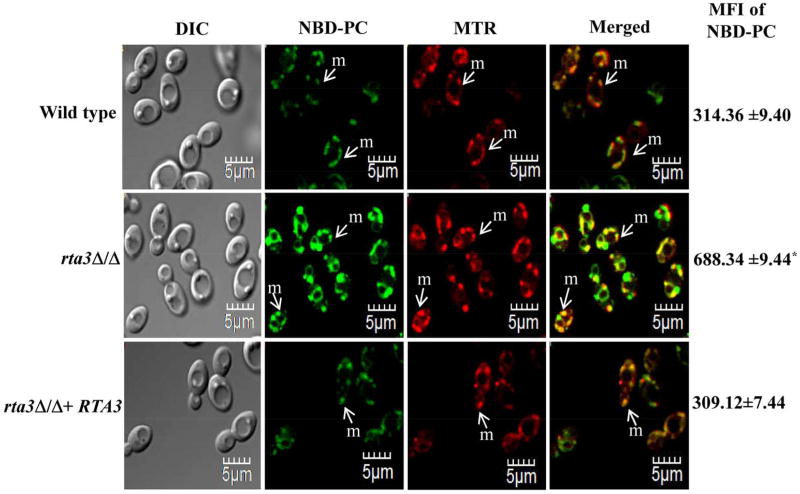
FIGURE 2. rta3Δ/Δ displays increased internalization of NBD-PC.
Strains were grown to an OD600 of 1, labelled with 5 µM NBD-labelled PC and co-stained with 20 nM MitoTracker™ Red (MTR) for 45 min at 30 °C. Cells were washed, kept in fresh SDC media for 30 min at 30 °C, washed with ice cold SC-azide three times and visualized by confocal microscopy. Values on the right indicate mean fluorescence intensity (MFI) of internalized NBD-PC in all strains measured by flow cytometry (*P < 0.01, Student’s t-test). Data represent the mean ± S.D of three independent experiments. Approximately 200 cells were visualized using confocal microscopy. m denotes mitochondria.

