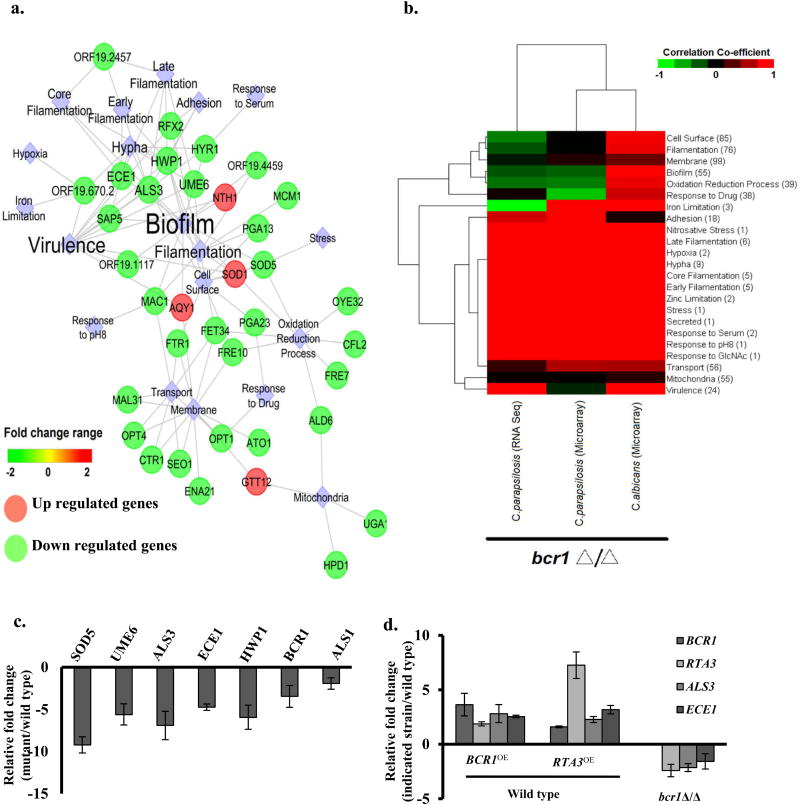
FIGURE 4. Transcriptional profiling of rta3Δ/Δ mutant.
(a) Visualization of the coexpression network in rta3Δ/Δ representing the structured rta3Δ/Δ distinct modules of differentially expressed genes involved in specific biological processes. Clustering was based on over-representation analysis using Cytoscape v8.0. Circles are genes while diamonds represent cellular processes. (b) Gene expression profile of rta3Δ/Δ cells was compared to the profile of the bcr1Δ/Δ cells from the indicated strains. Red indicates higher correlation, black indicates poor correlation, and green indicates negative correlation. The numbers within the bracket for each biological function/pathway indicate the number of genes differentially regulated in rta3Δ/Δ cells and involved in that particular function/pathway. (c) qPCR based expression analysis of selected genes in rta3Δ/Δ. (d) qPCR based expression analysis of selected genes in the indicated strains. Fold change (mutant/wild type) is calculated by 2−ΔΔCT and normalized to ACT1 (endogenous control) with the wild type strain as a calibrator. Values are mean ± S.D and are derived from three independent experiments.

