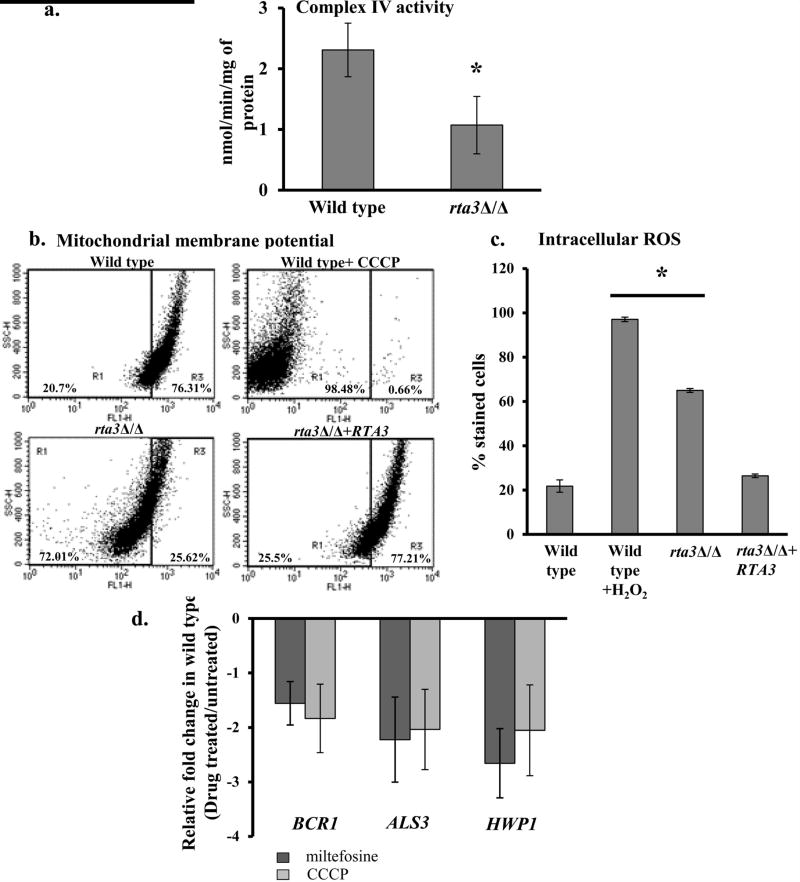
FIGURE 6. RTA3 and BCR1 expression are linked via mitochondrial energetics.
(a) The decrease in absorbance at 550 nm resulting from the oxidation of reduced cytochrome c was measured with purified mitochondrial preparations of wild type and rta3Δ/Δ cells. Specific activity of Complex IV was calculated as mentioned in Materials and Methods. *P< 0.05, Students t-test. (b) Flow cytometric analysis of cells grown until early log phase and stained with DiOC6(3), for mitochondrial membrane potential. The mutant displays a greater proportion of cells with depolarized mitochondria (left quadrant), similar to wild type cells treated with 50 µM CCCP used as a positive control. (c) Strains were grown until early log phase and incubated with 10 µM DFCDA for 30 min for intracellular ROS measurement. Wild-type cells were treated with 10 mM H2O2 for 30 min prior to staining as a positive control. *P< 0.005, Students t-test. (d) qPCR analysis of BCR1 and indicated target genes in wild type cells grown to an OD600 of 1 in the absence and presence of CCCP (50 µM; 30 min) and miltefosine (5 µg ml−1; 60 min). Fold change (treated/untreated) is calculated by 2−ΔΔCT, and normalised to ACT1 (endogenous control). Values are mean ± S.D. and are derived from three independent RNA preparations.

