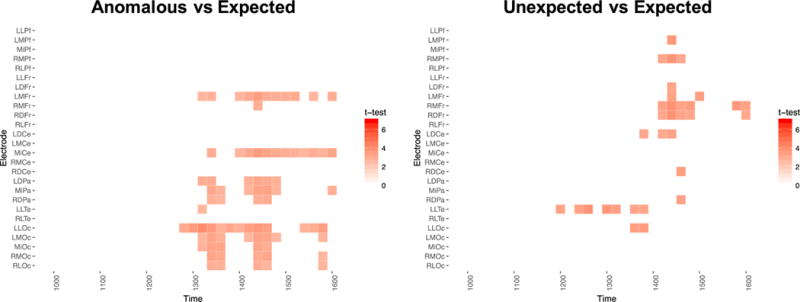
Figure 4.

Results of the mass-univariate test of the congruity and expectancy violations in parafoveal and foveal vision in older adults. Raster-style heat-map plots the local FDR controlled one-tailed t-tests of the expectancy and congruity violation effects. Results are presented in 20-ms bins beginning around the offset of the foveal N400 and extending until the end of the epoch. Anterior electrodes are depicted in the upper portion of the figure, medial electrodes are presented in the center, and posterior electrodes are presented in the lower portions of each panel. Significant positive t-tests are plotted in red.
