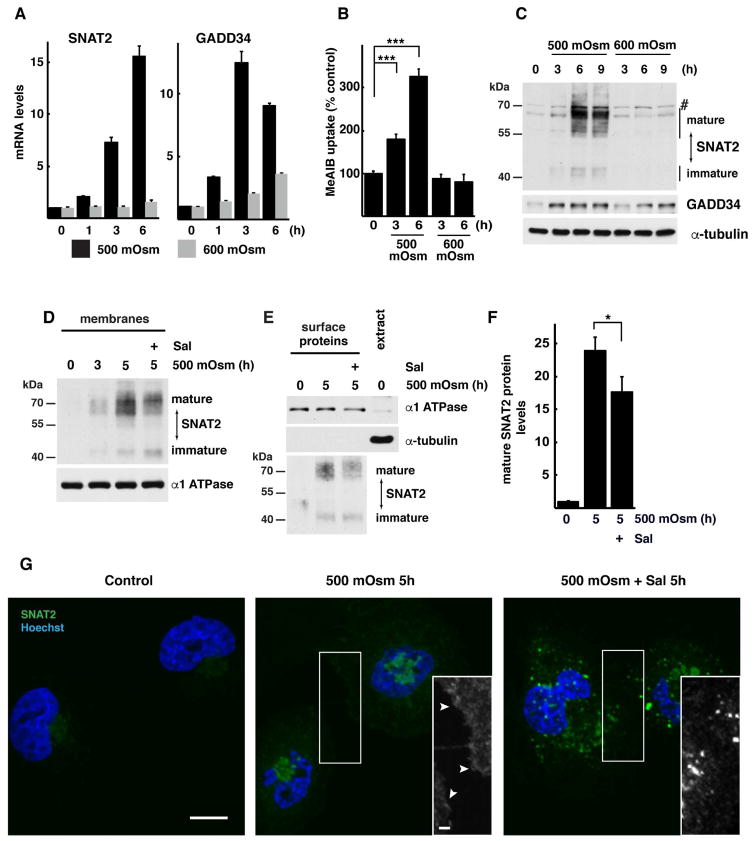
Fig. 1. Adaptation of human corneal epithelial cells to hyperosmotic stress involves SNAT2 and GADD34 induction.
A. RT-qPCR analysis of mRNAs from cells treated with 500 or 600 mOsm media for the indicated times. mRNA levels were normalized to the levels of GAPDH mRNA and presented as a fold of induction over control. B. SNAT2 activity, measured by 14C-MeAIB uptake in cells exposed to hyperosmotic media for indicated times. C. Immunodetection of SNAT2 and GADD34 proteins in extracts from cells treated with 500 or 600 mOsm media for the indicated times. A nonspecific band on the immunoblot is indicated (#). Positions of protein size markers are indicated. D. Western blot analysis of the membrane fraction from cells treated with 500 mOsm media for 5h in the presence of Sal003 (30 μM). Positions of protein size markers are indicated. E. Immunodetection of SNAT2 in plasma membrane fractions. Biotinylated surface proteins and cell extract (10 μg) were analyzed by Western blotting. Positions of protein size markers are indicated. F. Quantification of mature SNAT2 from Panel E by densitometry. Signal intensities of mature SNAT2 was normalized to α-1 ATPase. G. Cellular distribution of SNAT2 (green channel) was visualized by confocal fluorescence microscopy. Nuclei are stained with Hoechst. Black and white inserts show magnification of boxed image areas with green channel signal to demonstrate SNAT2 on plasma membrane (white arrowheads). Scale bars are 10 μm (main image) and 2 μm (insert). Data in panels A,B and F are represented as mean of 3 independent experiments ± SD.

