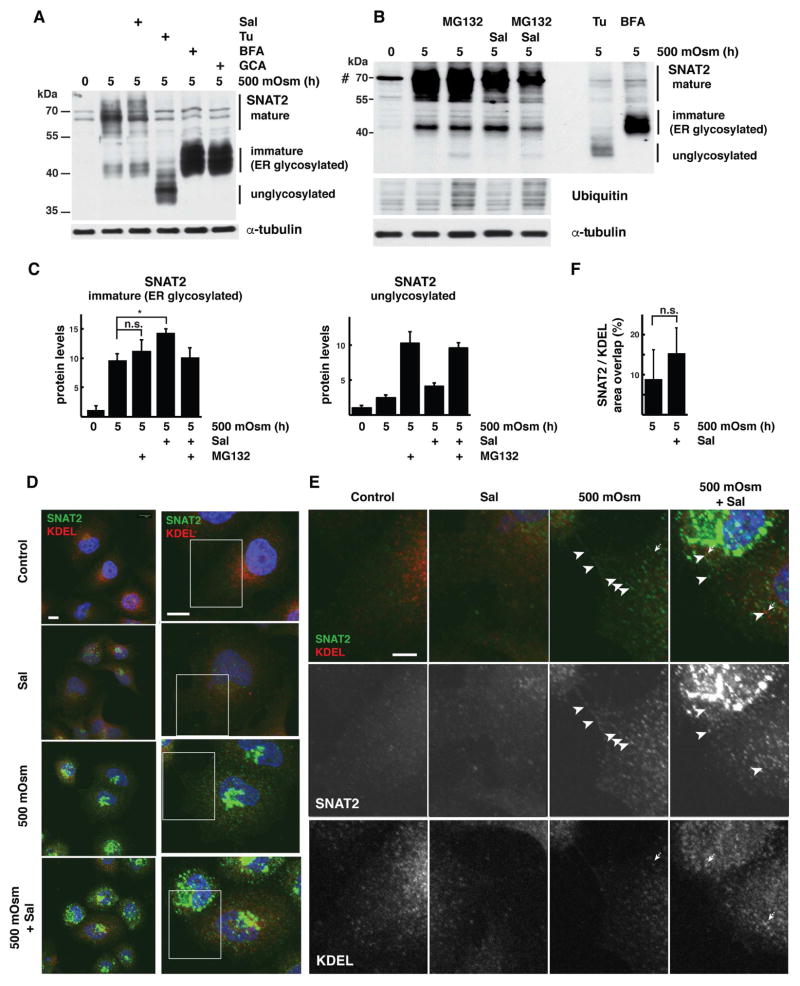
Fig. 2. Hyperosmotic stress-induced GADD34/PP1 activity promotes post-ER SNAT2 protein processing in corneal epithelial cells.
A. Western blot analysis of extracts from cells treated with 500 mOsm media alone for 5h or supplemented with Sal003 (30 μM), Tunicamycin (Tu, 500 nM), Brefeldin A (BFA, 20 μM) or Golgicide A (GCA, 20 μM). Positions of protein size markers are indicated. B. Western blot analysis of total cell extracts from cells treated with 500 mOsm media for 5h with or without Sup. Sal003 (30 μM). MG132 (100 μM) was added for the last 1h of treatment. Cell extracts from cells treated with 500 mOsm media and Tunicamycin (Tu) or Brefeldin A (BFA) were analyzed by loading one-third the amount of the other samples. C. Quantification of immature (left) and unglycosylated (right) SNAT2 levels from cells treated as in panel B. Signal intensities were normalized to α-tubulin. D. Subcellular distribution of SNAT2 (green channel) and ER-resident proteins (red channel, visualized by anti-KDEL antibody staining) in cells grown in control or 500 mOsm media for 5h with or without Sal003 (30 μM) addition. Scale bars are 10 μm. E. Boxed image areas from panel D, white arrowheads indicate SNAT2 protein, dotted arrows point to KDEL-positive structures. Scale bar is 1 μm. F. Quantification of SNAT2 co-localization with KDEL reporter in cells exposed to 500 mOsm media with or without Sal003. Masks of SNAT2 and KDEL signals were created and overlap between areas was calculated in 4 separate planes. 9 and 11 cells were analyzed respectively. Data re represented as mean ± SD.

